


GOLD Analysis: The Direction is Set to Come


Fundamental Analysis of GOLD
GOLD Key Takeaways
- Risk aversion subsides: The positive news of European and American negotiations has driven European and American stock markets up. Affected by the news that Japan has taken action to stabilize the bond market, the prices of long-term bonds in Japan and Europe and the United States have risen. Risk aversion has been reduced again and again, and gold has fallen for two consecutive days.
- Progress in European and American negotiations: US President Trump said he was encouraged by the EU’s accelerated trade negotiation process. In addition, EU officials have asked major EU companies and CEOs to provide details of their investment plans in the United States.
Technical Analysis of GOLD
GOLD Daily Chart Insights
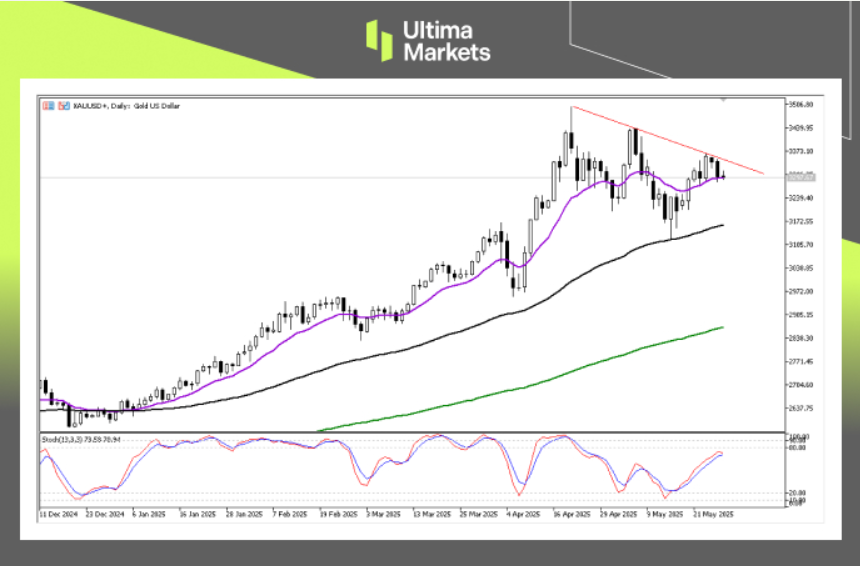
- Stochastic oscillator: The stochastic indicator at the bottom shows that the %K line (blue) is currently crossing the %D line (red) and continues to move upward, and both lines are above the 50-axis, close to the overbought area but not yet in. This shows that the market still has some upward momentum in the short term, but it is necessary to be alert to the risk of adjustment that may occur after entering the overbought area.
- Downward trend line: After hitting a stage high in mid-April, the price has pulled back. The subsequent rebound failed to break through the previous high and was blocked several times in recent days by a downward trend line (red trend line) connecting from the high point. The current price fluctuates between the purple 13EMA and this downward trend line, forming a converging triangle consolidation pattern. The purple 13EMA currently provides dynamic support for the price.
GOLD 2-hour Chart Analysis 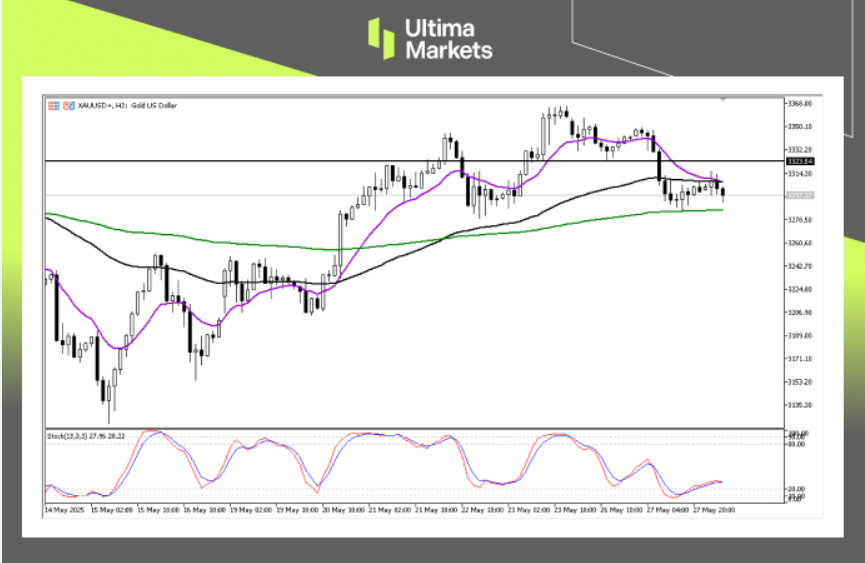
- Stochastic oscillator:The stochastic oscillator at the bottom shows that the %K line (blue) has turned upward from the oversold area (below 20) and crossed the %D line (red), forming a bullish golden cross signal. This indicates that there may be some rebound momentum or exhaustion of downward momentum in the short term. However, the validity of this signal requires the price to break through the upper resistance level to confirm.
- Short-term MA is about to turn short: The purple 13EMA is about to cross the black 65EMA, indicating that the short-term momentum is bearish. The price is currently running below these two short-term and medium-term MAs, which together form the dynamic resistance area above, especially around $3305-3315.
- Long-term MA support: It is worth noting that the price touched and temporarily held the green 200EMA (currently around $3280-3290) in the recent pullback. This long-term MA is the key to judging whether the medium-term trend has changed. As long as the price can sustain above the 200EMA, there is still a possibility for the bulls to fight back.
GOLD Pivot Indicator
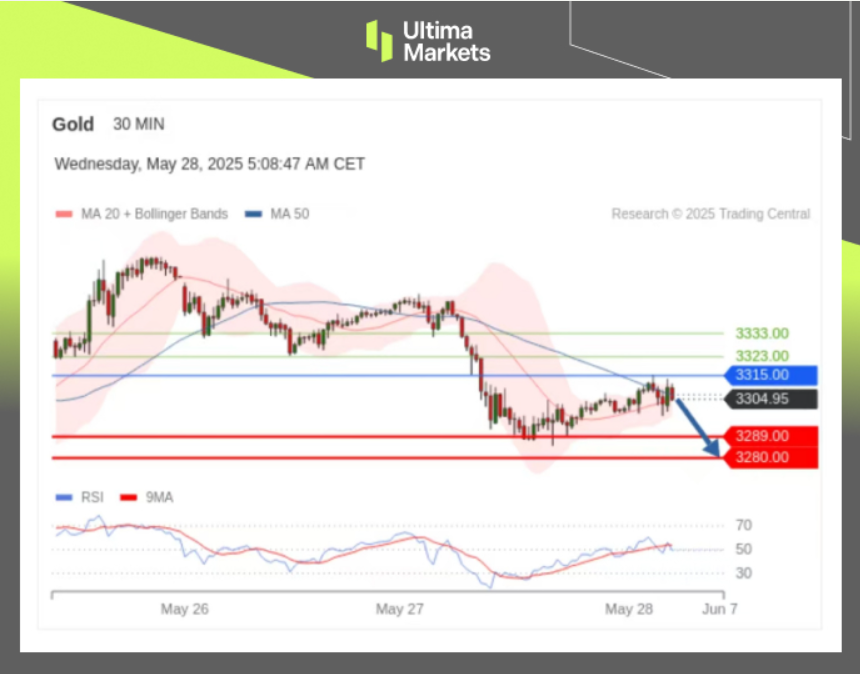
- According to the trading central in Ultima Markets APP, the central price of the day is established at 3315,
- Bullish Scenario: Bullish sentiment prevails above 3315, first target 3323 , second target 3333;
- Bearish Outlook: In a bearish scenario below 3315, first target 3289, second target 3280.
How to Navigate the Forex Market with Ultima MarketsTo navigate the complex world of trading successfully, it’s imperative to stay informed and make data-driven decisions. Ultima Markets remains dedicated to providing you with valuable insights to empower your financial journey. For personalized guidance tailored to your specific financial situation, please do not hesitate to contact Ultima Markets.
Join Ultima Markets today and access a comprehensive trading ecosystem equipped with the tools and knowledge needed to thrive in the financial markets. Stay tuned for more updates and analyses from our team of experts at Ultima Markets.
—–
Legal Documents
Ultima Markets, a trading name of Ultima Markets Ltd, is authorized and regulated by the Financial Services Commission “FSC” of Mauritius as an Investment Dealer (Full-Service Dealer, excluding Underwriting) (license No. GB 23201593). The registered office address: 2nd Floor, The Catalyst, 40 Silicon Avenue, Ebene Cybercity, 72201, Mauritius.
Copyright © 2025 Ultima Markets Ltd. All rights reserved.
Disclaimer
Comments, news, research, analysis, price, and all information contained in the article only serve as general information for readers and do not suggest any advice. Ultima Markets has taken reasonable measures to provide up-to-date information, but cannot guarantee accuracy, and may modify without notice. Ultima Markets will not be responsible for any loss incurred due to the application of the information provided.


Is the Gold Bull Done Charging? Year End Checkpoint

Gold Climbs to Two-Week High

Good news for Crypto bargain hunters

Good news for Crypto bargain hunters

EBC Markets Briefing | Yen lower on weak data; market frowns at Musk's pay package

How FCA Regulation Matters for Traders

Gold stabilised at $4,000, but the upward trend has already broken down


