Edit Your Comment
EUR/USD
Member Since Oct 11, 2013
769 posts
Dec 11, 2018 at 07:53
Member Since Apr 21, 2018
45 posts
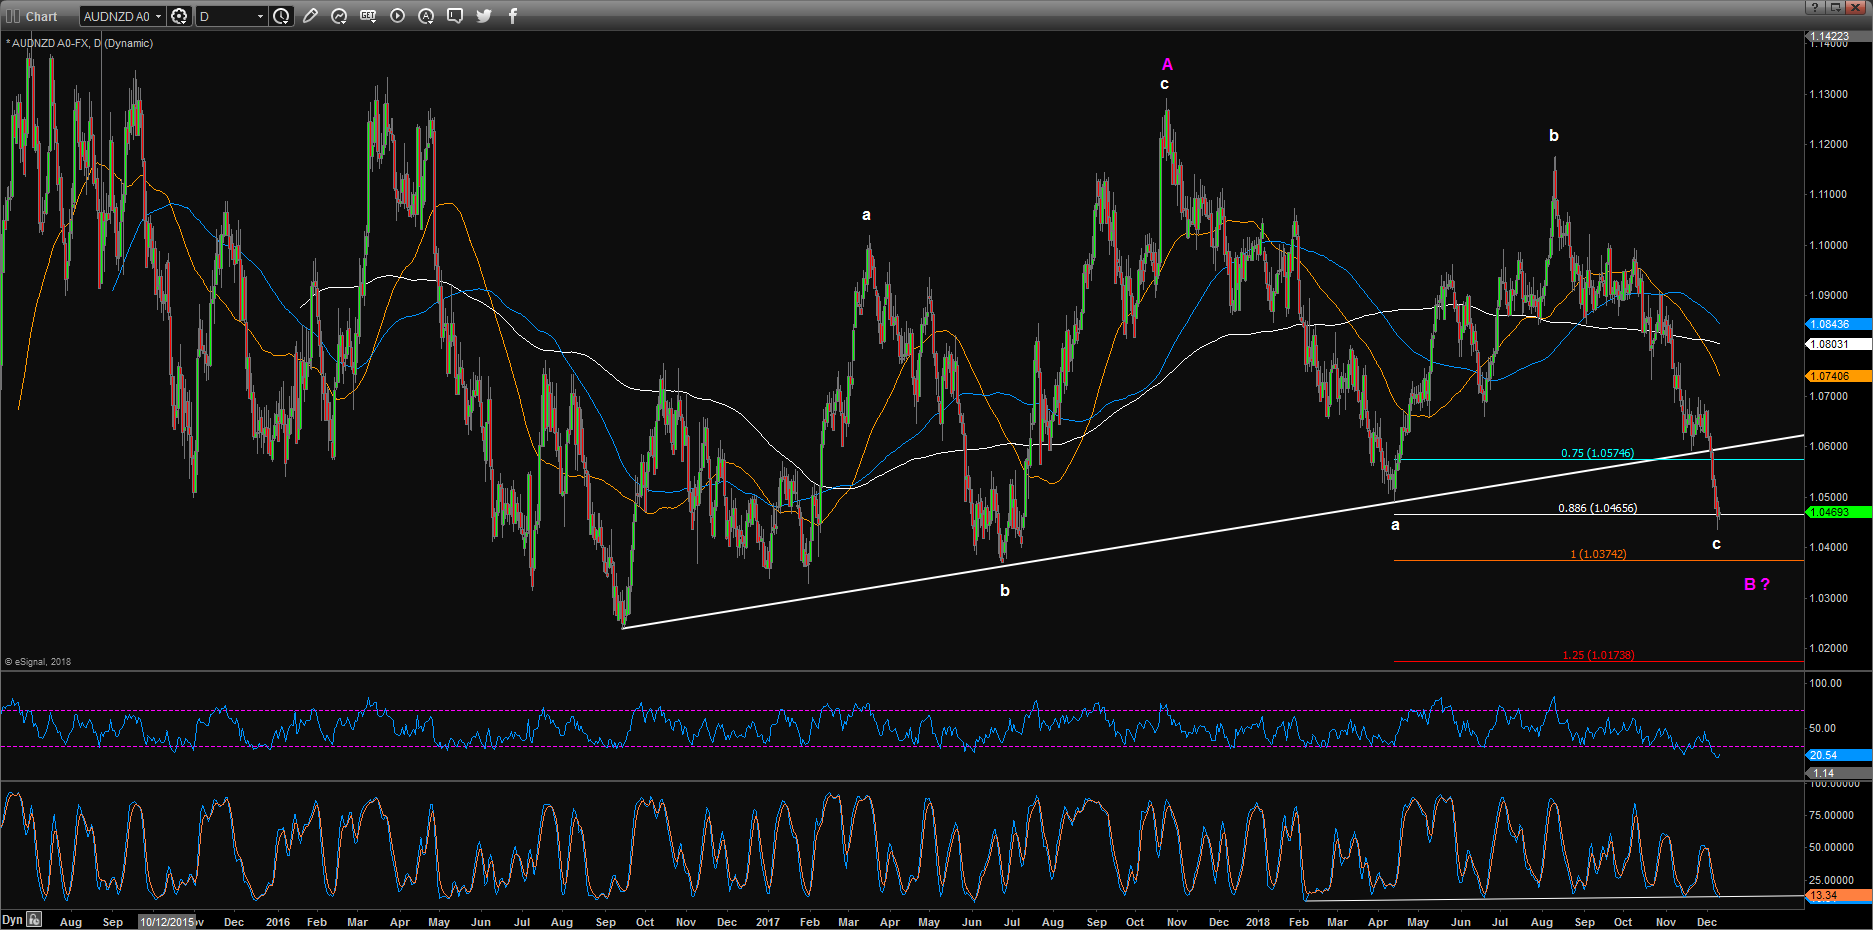
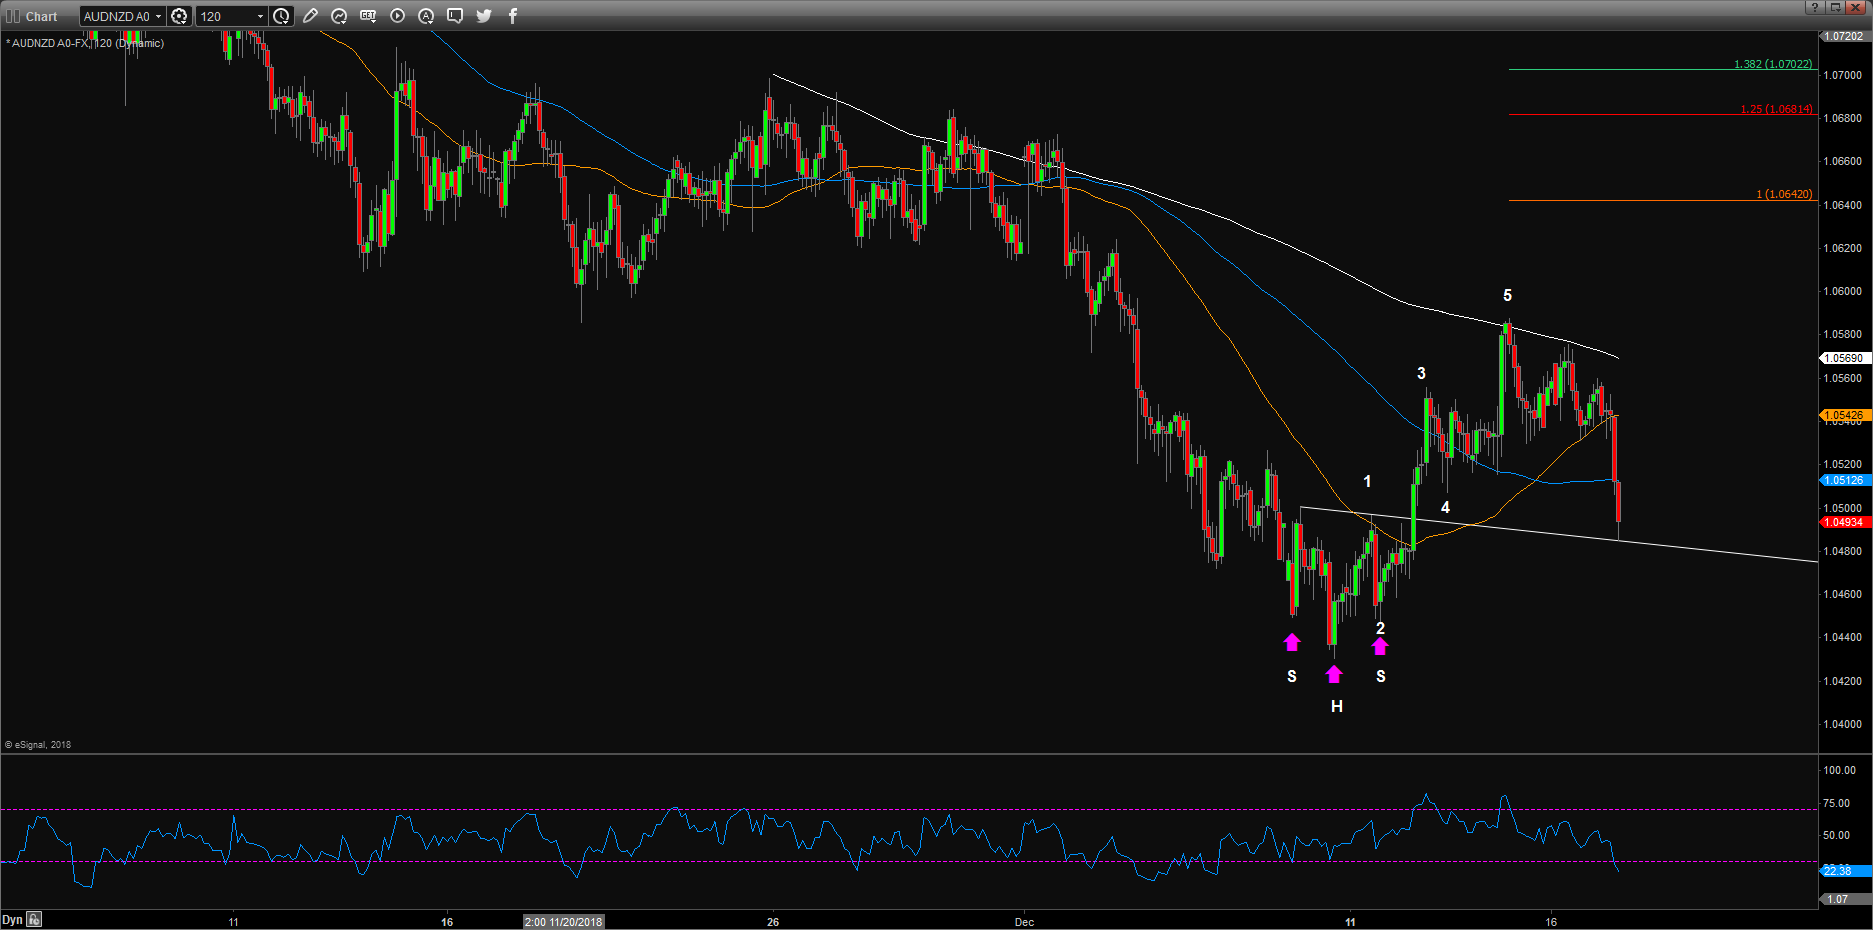
Elliottwave Analysis: AUDNZD, Long at spot
AUDNZD cloese below the long term uptrend line.
But further downside maybe limited from both fundamental and technical perspective.
To the downside, 1.0413/ 1.0374 ideally hold the price and turn the trend higher again.
Daily close above 1.0617 should be the first trend reversal sign.
AUDNZD Trade Idea: (Spot 1.0468)
Buy @ markert SL 1.0350 Take Profit @ 1.0580

http://forexsignal.love/aggressive-trend-scalper-ea/ 5 days' trial period is available. Welcome to backtesting!
Dec 11, 2018 at 09:02
Member Since Apr 21, 2018
45 posts
AmrSa posted:YueWang posted:
AUDNZD: up trend eroded, but downside maybe limited from here?
No, AUDNZD will continue in his downtrend. On the monthly chart, he created a symmetrical triangle then broke its bottom. He will continue in its downtrend and the first support at 1.01694
I think 1.0374, 1.0261 ideally hold any weekness and turn the trend higher again. Should it broken, would no doubt expose 1.0169/46 cycle lows. 😄
http://forexsignal.love/aggressive-trend-scalper-ea/ 5 days' trial period is available. Welcome to backtesting!
Member Since Apr 08, 2014
1140 posts
Dec 11, 2018 at 11:31
Member Since Apr 08, 2014
1140 posts
On yesterday session, the EURUSD initially rose with a wide range but found enough selling pressure near 1.1442 to reverse and closed near the low of the day, in addition, managed to close below Fridays’ low, which suggests a strong bearish momentum.
The currency pair closed shy below the 10-day moving average that should act now as a dynamic resistance although is trading below the 50 and the 200-day moving averages, all should provide a dynamic resistance.
The key levels to watch: a daily resistance at 1.1555, a daily resistance at 1.1459, the 50-day moving average at 1.1387 (resistance), the 10-day moving average at 1.1358 (resistance), October low at 1.1302 (support), a daily support 1.1236, 2018 low at 1.1214 (support) and 100 Fibonacci expansion at 1.1189 (support).
"I trade to make money not to be right."
Member Since Apr 08, 2014
1140 posts
Dec 12, 2018 at 10:11
Member Since Apr 08, 2014
1140 posts
On yesterday session, the EURUSD initially rose but found enough selling pressure near the 50-day moving average at 1.1385 to reverse and closed near the low of the day, in addition, managed to close below Mondays’ low, which a strong bearish momentum.
The currency pair traded below the 10, 50 and the 200-day moving averages and all should provide a dynamic resistance.
The key levels to watch: a daily resistance at 1.1555, a daily resistance at 1.1459, the 50-day moving average at 1.1380 (resistance), the 10-day moving average at 1.1353 (resistance), October low at 1.1302 (support), a daily support 1.1236, 2018 low at 1.1214 (support) and 100 Fibonacci expansion at 1.1189 (support).
"I trade to make money not to be right."
Dec 12, 2018 at 11:06
Member Since Apr 21, 2018
45 posts
Intraday Elliottwave Analysis: EURUSD, Lower stop loss, We stay short
EURUSD is consolidated in the triangle.
Price already closed back below daily Ichimoku Kijun-Sen.
We hold tactical short position from 1.1365, lower stop loss level to 1.1480, limited risk.
DXY is already near 161.8% projection target of a 5 wave rally, but no top sign yet.
Enough patience is needed at current stage.
However, unless we find a clearly reversal sign, we have no reason to directly trade against the major trend.
If the downtrend could resume, today EURUSD ideally one touch or close below 1.1285.
Daily close above 1.1343 will be the first recovery sign.
Intraday Trade Idea: (Spot 1.1331)
Sell Latentinterest Order: 1.1351

http://forexsignal.love/aggressive-trend-scalper-ea/ 5 days' trial period is available. Welcome to backtesting!
Member Since Apr 08, 2014
1140 posts
Dec 13, 2018 at 11:15
Member Since Apr 08, 2014
1140 posts
On yesterday session, the EURUSD rallied with a narrow range and closed near the high of the day, however, closed within Tuesdays’ range, which suggests being slightly on the bullish side of neutral.
The currency pair closed shy above the 10-day moving average that should act now as a dynamic support although is trading below the 50 and the 200-day moving averages, all should provide a dynamic resistance.
The key levels to watch: a daily resistance at 1.1555, a daily resistance at 1.1459, the 50-day moving average at 1.1377 (resistance), the 10-day moving average at 1.1361 (support), October low at 1.1302 (support), a daily support 1.1236, 2018 low at 1.1214 (support) and 100 Fibonacci expansion at 1.1189 (support).
"I trade to make money not to be right."
Dec 14, 2018 at 11:41
Member Since Apr 21, 2018
45 posts
Member Since Apr 08, 2014
1140 posts
Dec 14, 2018 at 12:02
Member Since Apr 08, 2014
1140 posts
On yesterday session, the EURUSD went back and forward without any clear direction consequently closed in the middle of the daily range, in addition, managed to close within Wednesday’s range, which suggests being clearly neutral, neither side is showing control.
The currency pair closed shy below the 10-day moving average that should act now as a dynamic resistance although is trading below the 50 and the 200-day moving averages, all should provide a dynamic resistance.
The key levels to watch: a daily resistance at 1.1555, a daily resistance at 1.1459, the 50-day moving average at 1.1373 (resistance), the 10-day moving average at 1.1354 (resistance), October low at 1.1302 (support), a daily support 1.1236, 2018 low at 1.1214 (support) and 100 Fibonacci expansion at 1.1189 (support).
"I trade to make money not to be right."
Dec 16, 2018 at 09:33
Member Since Apr 21, 2018
45 posts
Member Since Feb 04, 2014
17 posts
Dec 17, 2018 at 07:41
Member Since Apr 21, 2018
45 posts
Elliottwave Analysis: EURUSD, move stop to the entry and keep position flexible
EURUSD was finally downside resolved from the triangle.
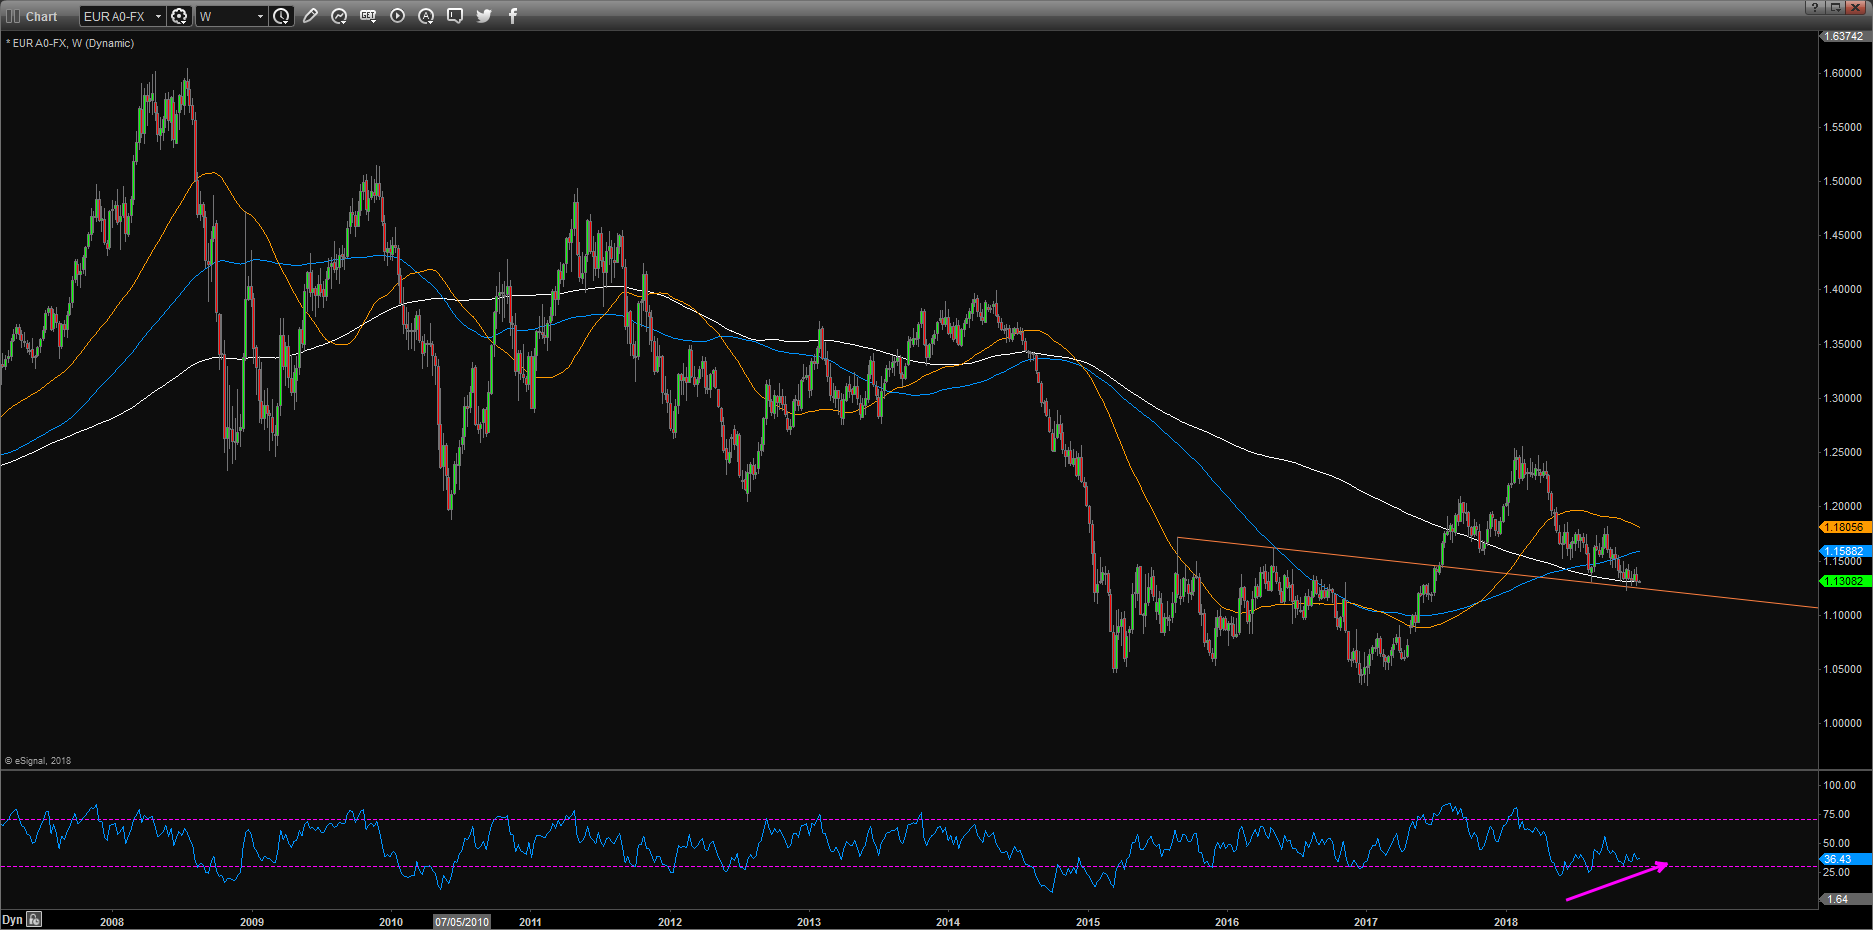
However, weekly support line is just ahead.
We still hold the short position from 1.1365, but will move stop to the entry.
FOMC and year-end re-balancing is just ahead, we should keep position flexible ahead key risk event.
Also will consider reverse to long on a clearly close above 1.1400.
Intraday Trade Idea: (spot 1.1306)
Sell Latentinterest Order: 1.1355
Long Latentinterest Order: 1.1246

http://forexsignal.love/aggressive-trend-scalper-ea/ 5 days' trial period is available. Welcome to backtesting!
Member Since Apr 08, 2014
1140 posts
Dec 17, 2018 at 12:03
Member Since Apr 08, 2014
1140 posts
On the last Friday’s session, the EURUSD fell with a wide range breaking below the symmetrical triangle although found enough buying pressure near 1.1269 to trim some of its losses, consequently closed in the middle of the daily range, in addition, managed to close below Thursday low, which suggests a strong bearish momentum.
The currency pair traded below the 10, 50 and the 200-day moving averages and all should provide a dynamic resistance.
The key levels to watch: a daily resistance at 1.1555, a daily resistance at 1.1459, the 50-day moving average at 1.1367 (resistance), the 10-day moving average at 1.1350 (resistance), October low at 1.1302 (support), a daily support 1.1236, 2018 low at 1.1214 (support) and 100 Fibonacci expansion at 1.1189 (support).
"I trade to make money not to be right."
Dec 18, 2018 at 07:43
Member Since Apr 21, 2018
45 posts
http://forexsignal.love/aggressive-trend-scalper-ea/ 5 days' trial period is available. Welcome to backtesting!
Member Since Apr 08, 2014
1140 posts
Dec 18, 2018 at 11:28
Member Since Apr 08, 2014
1140 posts
On yesterday session, the EURUSD rose with a narrow range and closed near the high of the day, in addition, managed to within Fridays’ range, which suggests being slightly on the bullish side of neutral.
The currency pair traded below the 10, 50 and the 200-day moving averages and all should provide a dynamic resistance.
The key levels to watch: a daily resistance at 1.1555, a daily resistance at 1.1459, the 50-day moving average at 1.1364 (resistance), the 10-day moving average at 1.1353 (resistance), October low at 1.1302 (support), a daily support 1.1236, 2018 low at 1.1214 (support) and 100 Fibonacci expansion at 1.1189 (support).
"I trade to make money not to be right."
Member Since Nov 09, 2018
204 posts
Member Since Dec 18, 2018
8 posts

*Commercial use and spam will not be tolerated, and may result in account termination.
Tip: Posting an image/youtube url will automatically embed it in your post!
Tip: Type the @ sign to auto complete a username participating in this discussion.


