


Advertisement
stevewalker - Manual Trading

forex_trader_59378
Member Since Jan 11, 2012
27 posts
Jul 18, 2012 at 05:42
very interesting, i hope to see a live account that u are trading, and possible link to mt4i or fxjunction. i am still learning as well.
Jul 18, 2012 at 06:21
stevewalker posted:
does any of you know what is the histogram just below the chart when volume enabled?😉
Well, Steve that histogram represents exactly what you say: "the volume". I.e. how many lots traded within the given time period.
😇

forex_trader_79941
Member Since Jun 06, 2012
1434 posts
Jul 18, 2012 at 10:22
thank you.
I was thinking the same thing for last 4 years.
on sunday I need the volume values to use at an EA first time in my life. what I find out is, in reality the histogram represent the price change( tick count ) of each bar. not amout (volume traded )
what ironic. same name as the trade volume(amount) but telling completly different story.
fyi
walker
Polyglot posted:
stevewalker posted:
does any of you know what is the histogram just below the chart when volume enabled?😉
Well, Steve that histogram represents exactly what you say: "the volume". I.e. how many lots traded within the given time period.
😇
forex_trader_79941
Member Since Jun 06, 2012
1434 posts
Jul 18, 2012 at 10:25
thank you
SanandaJmmanuel posted:
very interesting, i hope to see a live account that u are trading, and possible link to mt4i or fxjunction. i am still learning as well.
forex_trader_79941
Member Since Jun 06, 2012
1434 posts
Jul 18, 2012 at 10:32
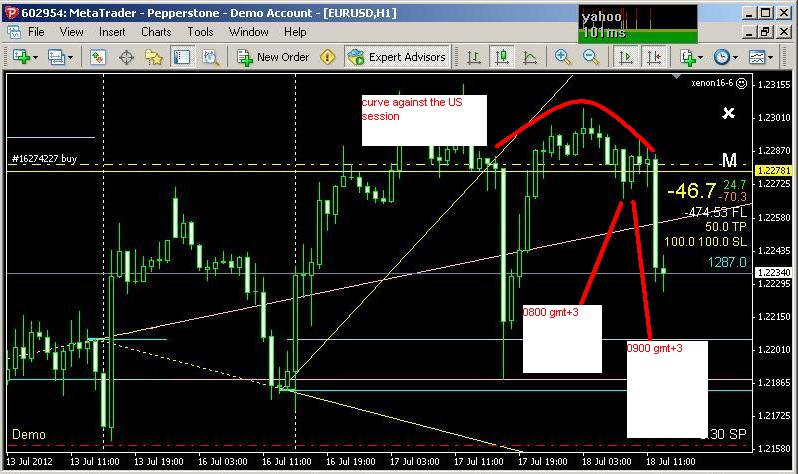
for this actual trade I would exit on 0800 gmt+3. but I fall a sleep.
the complete exit rule currently is very easy.
regardless of price actıons
if limit is Not Hit then
I should exit on 0800 gmt+3. if in loss then 0900 gmt+3. just before the EURO open.
the story is;
if price moving against US session( this means I will be in loss or very small profit ) then it is making a curve just like today. and generally it makes a correction around 0800 gmt+3.
today instead of closing trade BE Iam currently -40 pips. a personal mistake.
anyway I will keep trading the same way and will post the todays entry.
according to the system
1st day : +30 pip
2nd day : BE ( -40 pip if you fall a sleep )
stevewalker posted:
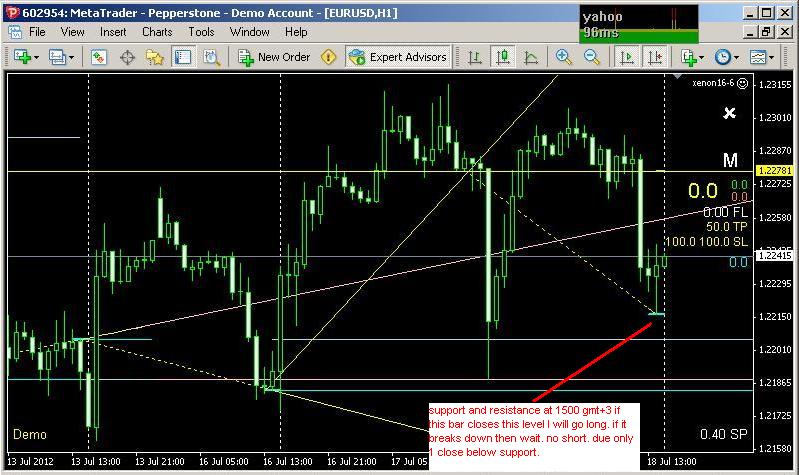
todays long entry
forex_trader_79941
Member Since Jun 06, 2012
1434 posts
Jul 18, 2012 at 10:35
here you can see the correct exit time and the curve
forex_trader_79941
Member Since Jun 06, 2012
1434 posts
Jul 18, 2012 at 10:43
the big drop as soon as the US open is the effect of Bernanke speech. this we can call as a big noise. dont take it as price action.
forex_trader_79941
Member Since Jun 06, 2012
1434 posts
Jul 18, 2012 at 12:05
forex_trader_79941
Member Since Jun 06, 2012
1434 posts
Jul 18, 2012 at 12:28
the problem about todays trade is price has used the same TL 4 times including the start point. this is very rare situation.
price does not wan to do predictable moves. I will open trade as planned and if match the conditions. but today most probably it will move against me.
price does not wan to do predictable moves. I will open trade as planned and if match the conditions. but today most probably it will move against me.
Jul 18, 2012 at 12:56
stevewalker posted:
thank you.
I was thinking the same thing for last 4 years.
on sunday I need the volume values to use at an EA first time in my life. what I find out is, in reality the histogram represent the price change( tick count ) of each bar. not amout (volume traded )
what ironic. same name as the trade volume(amount) but telling completly different story.
fyi
walker
Hmmm. I do not think that the result of your investigation is correct. As far as I can see the histogram has nothing at all to do with the amount of ticks covered by a bar. I am pretty sure it represents the volume of lots traded.
😇
forex_trader_79941
Member Since Jun 06, 2012
1434 posts
Jul 18, 2012 at 13:05
https://www.mql4.com/search#!keyword=volume&page=2
"I noticed that the volume indicator figures that I had are very different from those of colleagues of mine who get theirs from yahoo. So I called up my broker who said that in fact what the indicator shows is the number of updates, or number of ticks, rather than the amount of trading taking place. This seems very unsatisfactory"
"The volume indicator shows how many ticks are received in each bar. If you watch it you will see the total increment as each tick comes in. It is different between brokers because some pass on every tick and others filter them to bias things in their favour."
visit the link and read the comments.
volume is not volume(amount) as we think. it is tick counter for each bar.
Polyglot posted:
stevewalker posted:
thank you.
I was thinking the same thing for last 4 years.
on sunday I need the volume values to use at an EA first time in my life. what I find out is, in reality the histogram represent the price change( tick count ) of each bar. not amout (volume traded )
what ironic. same name as the trade volume(amount) but telling completly different story.
fyi
walker
Hmmm. I do not think that the result of your investigation is correct. As far as I can see the histogram has nothing at all to do with the amount of ticks covered by a bar. I am pretty sure it represents the volume of lots traded.
😇
forex_trader_79941
Member Since Jun 06, 2012
1434 posts
Jul 18, 2012 at 13:27
todays entry
forex_trader_79941
Member Since Jun 06, 2012
1434 posts
Jul 18, 2012 at 13:49
(edited Jul 18, 2012 at 13:50)
current trade got +43 MFE in 40 min. actually in +30 pip profit. lets see what will happen with Mr Bernanke Speech.
missed TP with 7 pips.
I could exit. but will try to do all as planned.
after had some data some changes can be done.
missed TP with 7 pips.
I could exit. but will try to do all as planned.
after had some data some changes can be done.
forex_trader_79941
Member Since Jun 06, 2012
1434 posts
Jul 18, 2012 at 13:58
this has nothing to do with the trades psted. this is another idea currently working on.
why I am looking for volumes.
here is the story;
when price move a direction it has break distance as every moving object.
we can not know how much it will move but we can calculate the min bareak distance when breaked.
this distance is the profit.
think that way.
if we can calculate the speed of price and if we know the Mass ( means volume ) we can calculate the real momentum of the price. this momentum will give us the min break distance of the price.
when calculated min break distance > our profit target then trade will be open to the price directon.
there could be 3 poss move.
1 price can keep moving our direction which is good.
2 price can break, then we will wait for the break distance to exit.
3 reverse move. if the calculations are correct this should be rare.
so I am looking to find the volumes at least traded by the mean broker.
walker
forex_trader_79941
Member Since Jun 06, 2012
1434 posts
Jul 18, 2012 at 14:16
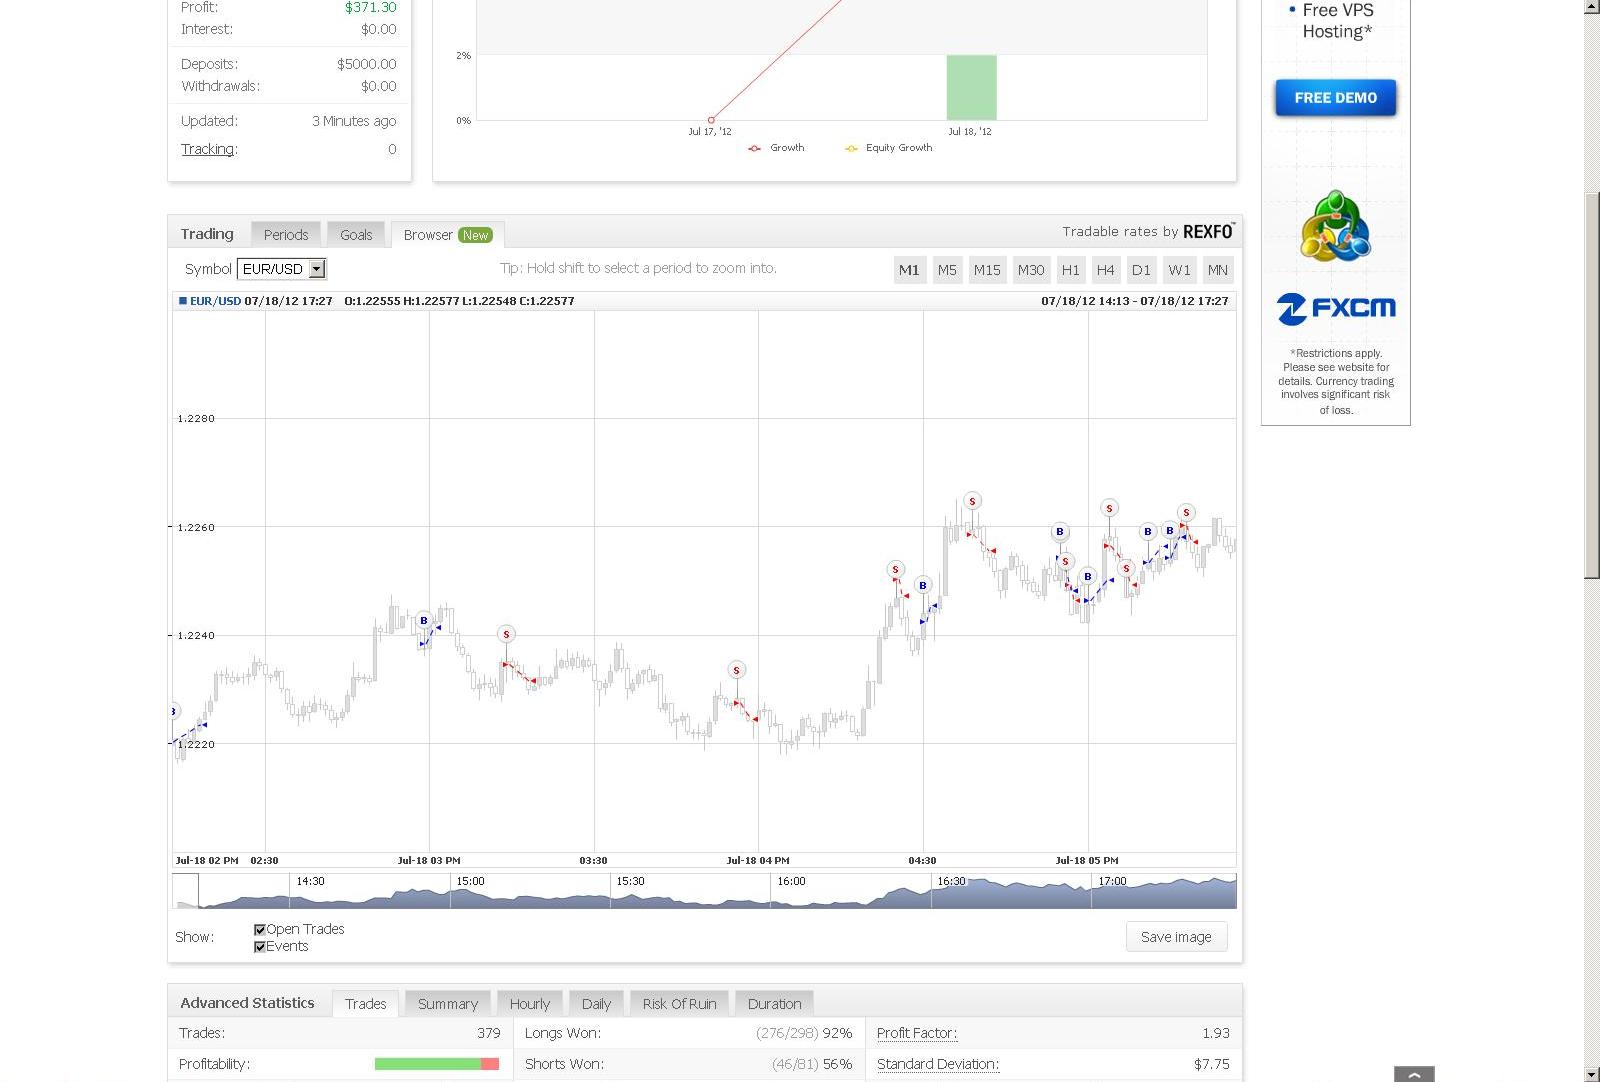
currently testing the one with no Mass added to the function.
https://www.myfxbook.com/members/stevewalker/tick/347112
lets see what will happen🙄
https://www.myfxbook.com/members/stevewalker/tick/347112
lets see what will happen🙄
stevewalker posted:
this has nothing to do with the trades psted. this is another idea currently working on.
why I am looking for volumes.
here is the story;
when price move a direction it has break distance as every moving object.
we can not know how much it will move but we can calculate the min bareak distance when breaked.
this distance is the profit.
think that way.
if we can calculate the speed of price and if we know the Mass ( means volume ) we can calculate the real momentum of the price. this momentum will give us the min break distance of the price.
when calculated min break distance > our profit target then trade will be open to the price directon.
there could be 3 poss move.
1 price can keep moving our direction which is good.
2 price can break, then we will wait for the break distance to exit.
3 reverse move. if the calculations are correct this should be rare.
so I am looking to find the volumes at least traded by the mean broker.
walker
forex_trader_79941
Member Since Jun 06, 2012
1434 posts
Jul 18, 2012 at 14:29
stevewalker posted:
currently testing the one with no Mass added to the function.
https://www.myfxbook.com/members/stevewalker/tick/347112
lets see what will happen🙄
stevewalker posted:
this has nothing to do with the trades psted. this is another idea currently working on.
why I am looking for volumes.
here is the story;
when price move a direction it has break distance as every moving object.
we can not know how much it will move but we can calculate the min bareak distance when breaked.
this distance is the profit.
think that way.
if we can calculate the speed of price and if we know the Mass ( means volume ) we can calculate the real momentum of the price. this momentum will give us the min break distance of the price.
when calculated min break distance > our profit target then trade will be open to the price directon.
there could be 3 poss move.
1 price can keep moving our direction which is good.
2 price can break, then we will wait for the break distance to exit.
3 reverse move. if the calculations are correct this should be rare.
so I am looking to find the volumes at least traded by the mean broker.
walker
forex_trader_79941
Member Since Jun 06, 2012
1434 posts
Jul 18, 2012 at 15:05
(edited Jul 18, 2012 at 15:10)
exit 43 pip profit. ( before fall a sleep )
forex_trader_79941
Member Since Jun 06, 2012
1434 posts
Jul 18, 2012 at 15:06
1st day : +30 pip
2nd day : BE ( -40 pip if you fall a sleep )
3rd day : +43 pip
2nd day : BE ( -40 pip if you fall a sleep )
3rd day : +43 pip
forex_trader_79941
Member Since Jun 06, 2012
1434 posts
Jul 18, 2012 at 15:20
market is very slow. should see when volatil. and also it is trading for only 2 days long with some changes at history.
lets see when will fail. why will fail.
lets see when will fail. why will fail.
stevewalker posted:
stevewalker posted:
currently testing the one with no Mass added to the function.
https://www.myfxbook.com/members/stevewalker/tick/347112
lets see what will happen🙄
stevewalker posted:
this has nothing to do with the trades psted. this is another idea currently working on.
why I am looking for volumes.
here is the story;
when price move a direction it has break distance as every moving object.
we can not know how much it will move but we can calculate the min bareak distance when breaked.
this distance is the profit.
think that way.
if we can calculate the speed of price and if we know the Mass ( means volume ) we can calculate the real momentum of the price. this momentum will give us the min break distance of the price.
when calculated min break distance > our profit target then trade will be open to the price directon.
there could be 3 poss move.
1 price can keep moving our direction which is good.
2 price can break, then we will wait for the break distance to exit.
3 reverse move. if the calculations are correct this should be rare.
so I am looking to find the volumes at least traded by the mean broker.
walker


