Advertisement
stevewalker - Manual Trading

forex_trader_79941
Участник с Jun 06, 2012
1434 комментариев
Jul 18, 2012 at 20:14
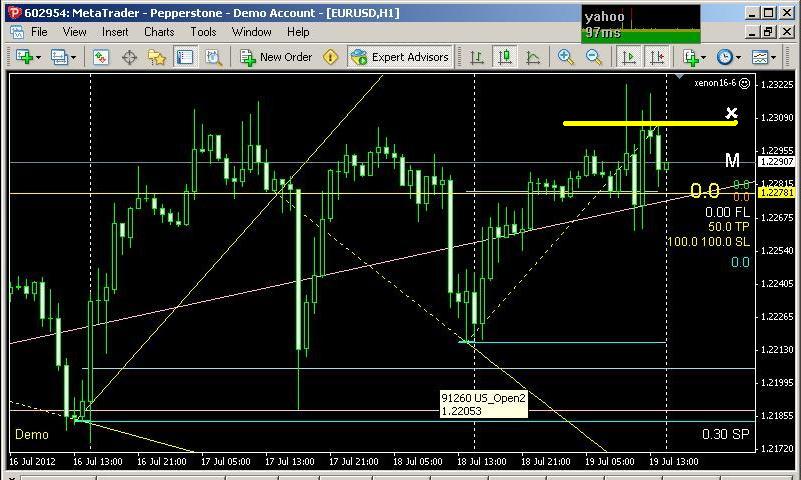
see how price chasing the TL and support/Rezistance
forex_trader_79941
Участник с Jun 06, 2012
1434 комментариев
Jul 18, 2012 at 22:38
visit the link.
https://orderbookfx.com/
there is a users manual on upper right corner.
just have alook at that and see how DOM is important.
I will give a try
walker
https://orderbookfx.com/
there is a users manual on upper right corner.
just have alook at that and see how DOM is important.
I will give a try
walker
Участник с Jul 04, 2010
14 комментариев
Jul 19, 2012 at 08:07
stevewalker posted:
https://www.mql4.com/search#!keyword=volume&page=2
"I noticed that the volume indicator figures that I had are very different from those of colleagues of mine who get theirs from yahoo. So I called up my broker who said that in fact what the indicator shows is the number of updates, or number of ticks, rather than the amount of trading taking place. This seems very unsatisfactory"
"The volume indicator shows how many ticks are received in each bar. If you watch it you will see the total increment as each tick comes in. It is different between brokers because some pass on every tick and others filter them to bias things in their favour."
visit the link and read the comments.
volume is not volume(amount) as we think. it is tick counter for each bar.
Polyglot posted:
stevewalker posted:
thank you.
I was thinking the same thing for last 4 years.
on sunday I need the volume values to use at an EA first time in my life. what I find out is, in reality the histogram represent the price change( tick count ) of each bar. not amout (volume traded )
what ironic. same name as the trade volume(amount) but telling completly different story.
fyi
walker
Hmmm. I do not think that the result of your investigation is correct. As far as I can see the histogram has nothing at all to do with the amount of ticks covered by a bar. I am pretty sure it represents the volume of lots traded.
😇
Hi Steve,
It seems you are right about the number of ticks. Following the movements in "Market Watch" window and looking at the volume indicator in "Data Window" it becomes clear. Always good to learn something new.
😇

Участник с Apr 12, 2012
154 комментариев
Jul 19, 2012 at 09:53
eur/usd. 2340-2150-2800 /
I do not expect lower 2150 at all.........😄
I do not expect lower 2150 at all.........😄

Участник с Jan 14, 2010
541 комментариев
Jul 19, 2012 at 10:18
Mars30 posted:
eur/usd. 2340-2150-2800 /
I do not expect lower 2150 at all.........😄
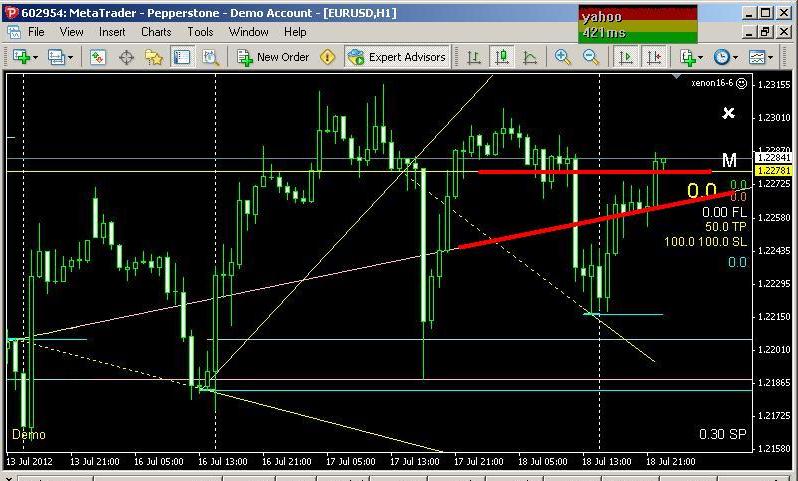
I agree it should go a bit higher before continuing going down:

Приложения:

Участник с Jan 14, 2010
2279 комментариев
Jul 19, 2012 at 10:34
Yeah, it usually goes like this, fails to break, retarce/ pull back, then drop or jump and break. need to gather orders momentum for break down. but everything can happen, if lot's of bad news from USA trend might reverse too.
forex_trader_79941
Участник с Jun 06, 2012
1434 комментариев
Jul 19, 2012 at 11:51
as expected it failed.
failed becouse I am able to calculate only Acceleration not the momentum due I have no Mass(Volume) data.
But no worries.
last night before fall a sleep ( I can not sleep by going to bed, I fall a sleep infront of screen or TV for years 🙄) I had improved the code. now it is collecting diagnostic data. I had worked for an hour and there are poss to fix the issues. will see soon.
stevewalker posted:
market is very slow. should see when volatil. and also it is trading for only 2 days long with some changes at history.
lets see when will fail. why will fail.
stevewalker posted:
stevewalker posted:
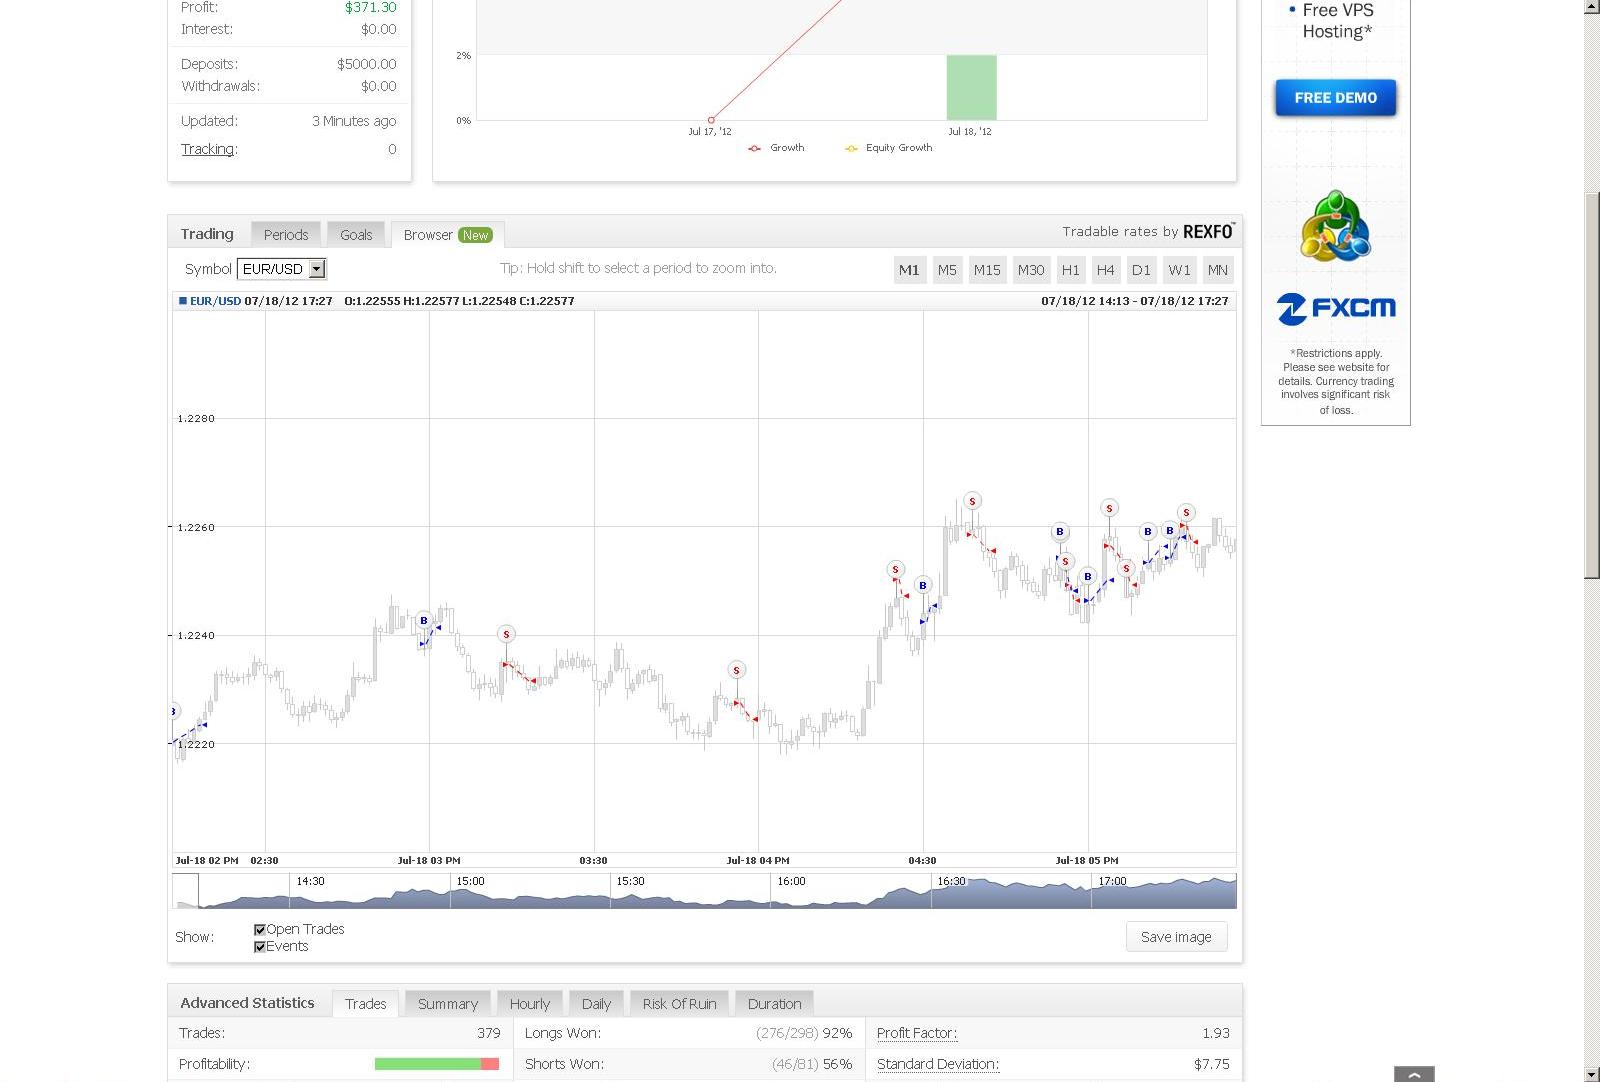
currently testing the one with no Mass added to the function.
https://www.myfxbook.com/members/stevewalker/tick/347112
lets see what will happen🙄
stevewalker posted:
this has nothing to do with the trades psted. this is another idea currently working on.
why I am looking for volumes.
here is the story;
when price move a direction it has break distance as every moving object.
we can not know how much it will move but we can calculate the min bareak distance when breaked.
this distance is the profit.
think that way.
if we can calculate the speed of price and if we know the Mass ( means volume ) we can calculate the real momentum of the price. this momentum will give us the min break distance of the price.
when calculated min break distance > our profit target then trade will be open to the price directon.
there could be 3 poss move.
1 price can keep moving our direction which is good.
2 price can break, then we will wait for the break distance to exit.
3 reverse move. if the calculations are correct this should be rare.
so I am looking to find the volumes at least traded by the mean broker.
walker
forex_trader_79941
Участник с Jun 06, 2012
1434 комментариев
Jul 19, 2012 at 11:52
this has moved up over TL & suport/resistance.
in 10 min I will get the todays entry point.
in 10 min I will get the todays entry point.
stevewalker posted:
see how price chasing the TL and support/Rezistance
forex_trader_79941
Участник с Jun 06, 2012
1434 комментариев
Jul 19, 2012 at 11:55
Last weeks low candles reminds me a reversal operation.
bars are very small and lower candles are very big for at least 5 days.
for me this means this is not a pull back. a reversal operation from the support.
bars are very small and lower candles are very big for at least 5 days.
for me this means this is not a pull back. a reversal operation from the support.
James_Bond posted:
Mars30 posted:
eur/usd. 2340-2150-2800 /
I do not expect lower 2150 at all.........😄
I agree it should go a bit higher before continuing going down:
forex_trader_79941
Участник с Jun 06, 2012
1434 комментариев
Jul 19, 2012 at 11:58
yes another trick from MT4 geneous programmes. it is full of tricks.
the issue is, I could not find any information at MT4 users manual. full of tricks.😡
the issue is, I could not find any information at MT4 users manual. full of tricks.😡
Polyglot posted:
stevewalker posted:
https://www.mql4.com/search#!keyword=volume&page=2
"I noticed that the volume indicator figures that I had are very different from those of colleagues of mine who get theirs from yahoo. So I called up my broker who said that in fact what the indicator shows is the number of updates, or number of ticks, rather than the amount of trading taking place. This seems very unsatisfactory"
"The volume indicator shows how many ticks are received in each bar. If you watch it you will see the total increment as each tick comes in. It is different between brokers because some pass on every tick and others filter them to bias things in their favour."
visit the link and read the comments.
volume is not volume(amount) as we think. it is tick counter for each bar.
Polyglot posted:
stevewalker posted:
thank you.
I was thinking the same thing for last 4 years.
on sunday I need the volume values to use at an EA first time in my life. what I find out is, in reality the histogram represent the price change( tick count ) of each bar. not amout (volume traded )
what ironic. same name as the trade volume(amount) but telling completly different story.
fyi
walker
Hmmm. I do not think that the result of your investigation is correct. As far as I can see the histogram has nothing at all to do with the amount of ticks covered by a bar. I am pretty sure it represents the volume of lots traded.
😇
Hi Steve,
It seems you are right about the number of ticks. Following the movements in "Market Watch" window and looking at the volume indicator in "Data Window" it becomes clear. Always good to learn something new.
😇
forex_trader_79941
Участник с Jun 06, 2012
1434 комментариев
Jul 19, 2012 at 12:03
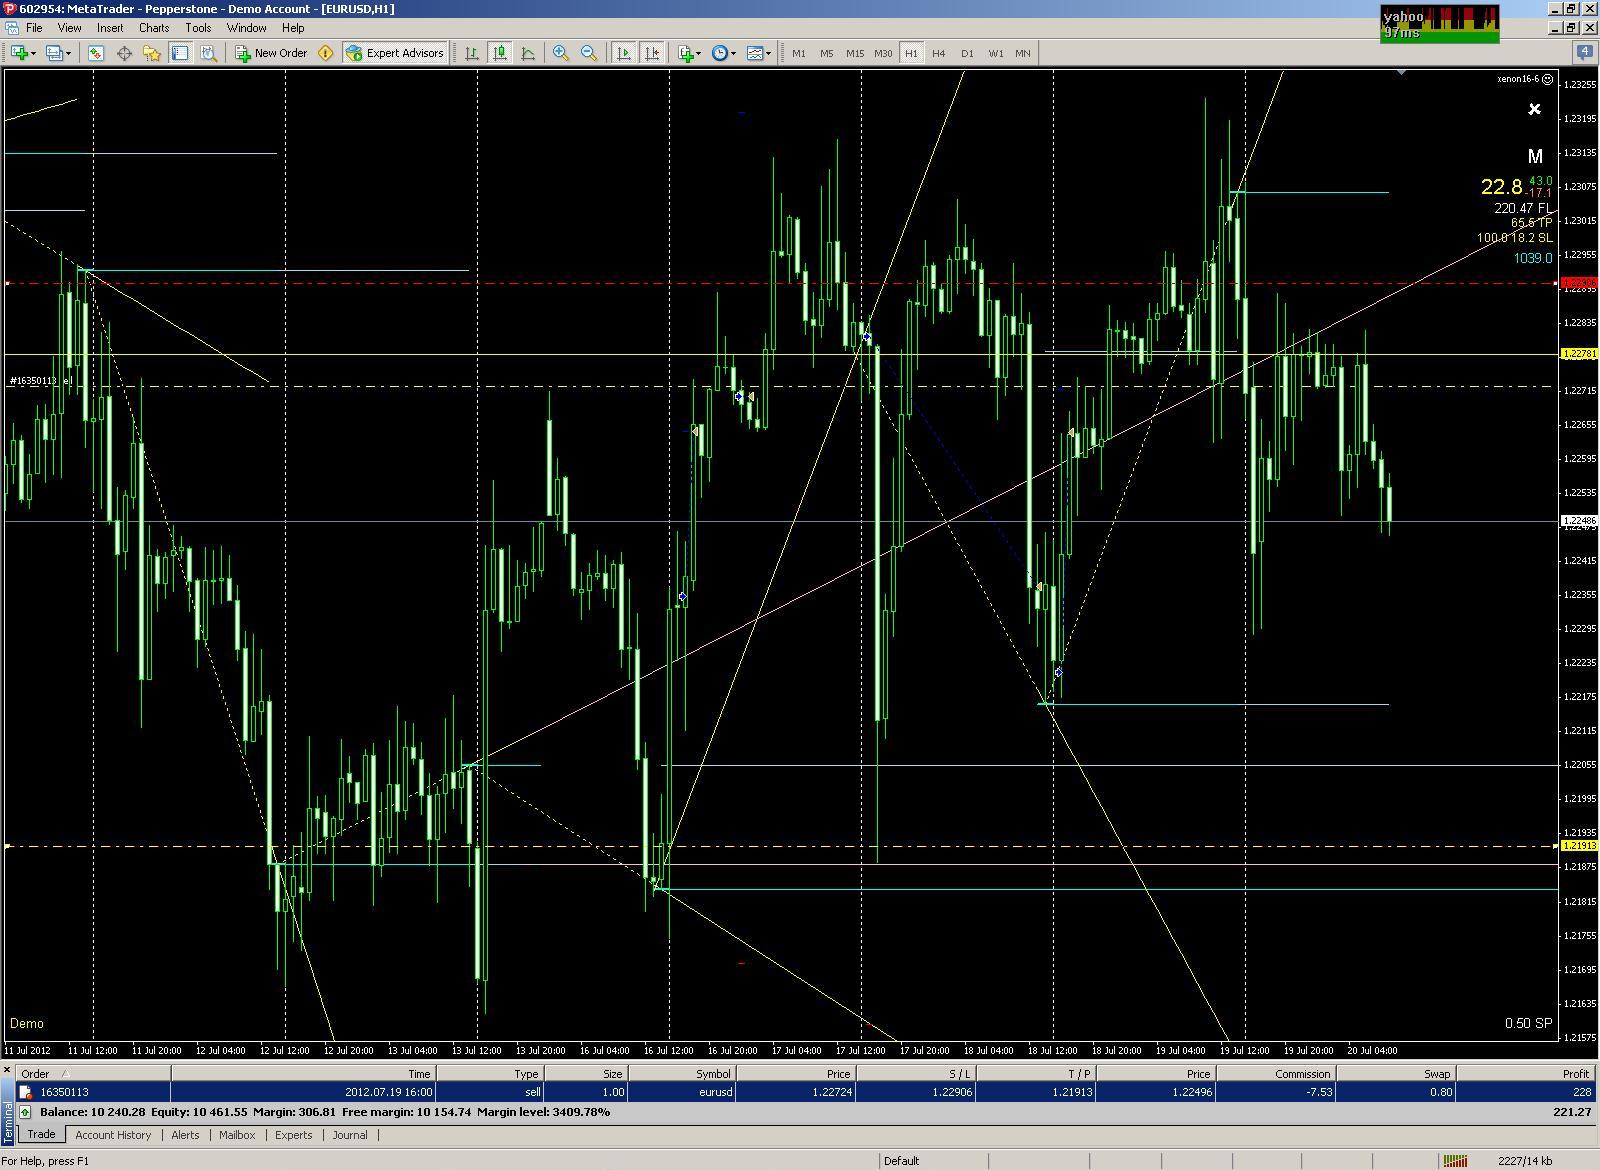
tick Yellow line is my Support&Resistance
as usual I will wait for the actual bar close may be one more to see the direction.
currently direction is short but there are also a strong TL and yesterdays supprort.
lets see.
as usual I will wait for the actual bar close may be one more to see the direction.
currently direction is short but there are also a strong TL and yesterdays supprort.
lets see.
forex_trader_79941
Участник с Jun 06, 2012
1434 комментариев
Jul 19, 2012 at 13:01
(отредактировано Jul 19, 2012 at 13:01)
todays Short entry
forex_trader_79941
Участник с Jun 06, 2012
1434 комментариев
Jul 19, 2012 at 14:29
this week my lucky number 43
it again returned from +43 pip and missed tp with 7 pip
will wait until 0800 gmt+3
it again returned from +43 pip and missed tp with 7 pip
will wait until 0800 gmt+3
forex_trader_79941
Участник с Jun 06, 2012
1434 комментариев
Jul 19, 2012 at 14:45
(отредактировано Jul 19, 2012 at 14:47)
Manual Trading 1Hr Us Open Log
Start : 17-07-2012
Days
____MFE pip____MAE pip____P/L pip________Exp_____________________________________________
1____79_________2________30___________according to the plan it should be 50 pip TP
2____23________93_______-45___________according to the plan I should exit on BE at 0900 gmt+3
3___100_________5________42___________according to the plan it should be 50 pip TP
4
forex_trader_79941
Участник с Jun 06, 2012
1434 комментариев
Jul 19, 2012 at 15:43
momentum EA ( actually Acceleration EA )
currently I am looking the 20 tick acce. on the top of that when I look 20^2 ticks acce same direction it seems to be work.
but this has to be tested for a long time.
published account still trading with only first 20 tick acce and collecting data.
currently I am looking the 20 tick acce. on the top of that when I look 20^2 ticks acce same direction it seems to be work.
but this has to be tested for a long time.
published account still trading with only first 20 tick acce and collecting data.
forex_trader_79941
Участник с Jun 06, 2012
1434 комментариев
Jul 19, 2012 at 16:18
it will be redicilus if I think any EA will work with fix setup after all that coding and testing experience.
so what I am going to do is
EA will start run with the results of collected data.
but it will open all trades with the rule below;
lot 1/1 with the setup parameters
lot 1/10 with the against setup parameters
this will allow me to collect data and work on it. if EA work properly then I can code a algo for "data work part".
stevewalker posted:
momentum EA ( actually Acceleration EA )
currently I am looking the 20 tick acce. on the top of that when I look 20^2 ticks acce same direction it seems to be work.
but this has to be tested for a long time.
published account still trading with only first 20 tick acce and collecting data.

Участник с Jan 09, 2012
263 комментариев
Jul 19, 2012 at 17:53
😄 I started to go short in 1.2267, when the price moves up I put a short position again in 1.2299
by the way, how does that xenon 16-6 works ?
by the way, how does that xenon 16-6 works ?
There is no religion higher than truth
forex_trader_79941
Участник с Jun 06, 2012
1434 комментариев
Jul 19, 2012 at 18:08
I had zig-zag
first had +43 MFE then -17 MAE now +8 pips entry 1.22724
will wait until 0800/0900 gmt+3
xenon16 is my laboratory EA for now. I can test any idea with it including complex trendlines or what ably yout think. hedge grid trend manual BT , indicators ....................
first had +43 MFE then -17 MAE now +8 pips entry 1.22724
will wait until 0800/0900 gmt+3
xenon16 is my laboratory EA for now. I can test any idea with it including complex trendlines or what ably yout think. hedge grid trend manual BT , indicators ....................
angelwing2007 posted:
😄 I started to go short in 1.2267, when the price moves up I put a short position again in 1.2299
by the way, how does that xenon 16-6 works ?
Участник с Jan 14, 2010
2279 комментариев
Jul 20, 2012 at 01:13
Generally I see you use older TLs to define currencies moves. yes, i saw it too.