


Advertisement
Market structure
Oct 26, 2024 at 11:14
149 Zobrazení
3 Replies

Členom od Sep 26, 2023
1 príspevkov
Oct 26, 2024 at 11:14
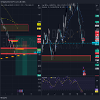
How to draw market structure

Členom od Nov 17, 2022
2 príspevkov
Oct 26, 2024 at 21:24
WHAT DO YOU MEAN?
EXPLAIN MORE
EXPLAIN MORE
Prílohy:
Become ATTACHED To the PROCESS not the OUTCOME

Členom od Jun 10, 2024
17 príspevkov
Oct 31, 2024 at 09:02
To draw market structure effectively, follow these steps:
Identify the Trend: Determine if the market is in an uptrend (higher highs and higher lows), downtrend (lower highs and lower lows), or range-bound (sideways movement).
Mark Key Levels: Draw horizontal lines at significant highs and lows (support and resistance zones). These areas show where price has reversed or stalled before, helping to define the structure.
Label Swing Points: Mark each swing high and swing low. Uptrends have higher highs (HH) and higher lows (HL), while downtrends have lower highs (LH) and lower lows (LL).
Connect the Points: Draw trendlines to connect consecutive swing points in the direction of the trend. This visualizes the market flow.
Watch for Breaks: Note when price breaks previous highs or lows, which can indicate a change in structure (e.g., an uptrend shifting to a downtrend).
By mapping these points, you can outline the market structure and better understand price direction and potential reversals.
Helped 20K people around 200 countries, made forex easy.


*Komerčné použitie a spam nebudú tolerované a môžu viesť k zrušeniu účtu.
Tip: Uverejnením adresy URL obrázku /služby YouTube sa automaticky vloží do vášho príspevku!
Tip: Zadajte znak @, aby ste automaticky vyplnili meno používateľa, ktorý sa zúčastňuje tejto diskusie.


