Advertisement
Technical & Fundamental Analysis by Sold ECN Securities

Medlem sedan Dec 08, 2021
330 inlägg
Jan 25, 2022 at 16:26
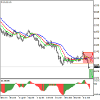
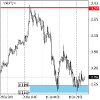
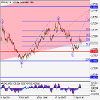
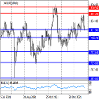
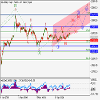
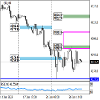
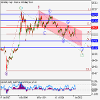
NZD/USD
New Zealand Dollar under pandemic pressure
Current trend
This week, the NZD/USD pair continued to decline and reached three-month lows around 0.6645. The decline in the trading instrument is due to two main factors: the expectation of a serious tightening of monetary policy by the US Fed and the deterioration of the epidemiological situation in New Zealand.
In general, the country's economy is recovering moderately, as evidenced by December statistics: retail sales increased by 0.4%, and the business activity index in the manufacturing sector increased from 50.6 to 53.7 points, but in the near future it may be under pressure due to the increase in the incidence of the COVID-19 Omicron strain. Since Sunday, new quarantine restrictions have come into force, a mask regime is being introduced, and the work of public institutions is limited. These measures may create pressure on the service sector and slow down the economic recovery.
The USD now looks preferable to its New Zealand competitor, as investors expect decisive action from the US Fed. The agency may announce plans to adjust monetary policy during a two-day meeting of the regulator on Wednesday. Experts believe that a serious increase in inflation may cause tougher actions by officials, and they will raise the rate more than four times in 2022. At the same time, it is unlikely that the current downturn in the stock markets will force the agency to soften its position. In these conditions, prerequisites are being created for the further strengthening of the USD against alternative assets.
Support and resistance
Resistance levels: 0.6780, 0.6835, 0.6958.
Support levels: 0.6592, 0.6500.
Bilagor:
Solid ECN, a True ECN Broker

Medlem sedan Jul 19, 2020
742 inlägg
Jan 26, 2022 at 08:38
SolidECN posted:
NZD/USD
New Zealand Dollar under pandemic pressure
Current trend
This week, the NZD/USD pair continued to decline and reached three-month lows around 0.6645. The decline in the trading instrument is due to two main factors: the expectation of a serious tightening of monetary policy by the US Fed and the deterioration of the epidemiological situation in New Zealand.
In general, the country's economy is recovering moderately, as evidenced by December statistics: retail sales increased by 0.4%, and the business activity index in the manufacturing sector increased from 50.6 to 53.7 points, but in the near future it may be under pressure due to the increase in the incidence of the COVID-19 Omicron strain. Since Sunday, new quarantine restrictions have come into force, a mask regime is being introduced, and the work of public institutions is limited. These measures may create pressure on the service sector and slow down the economic recovery.
The USD now looks preferable to its New Zealand competitor, as investors expect decisive action from the US Fed. The agency may announce plans to adjust monetary policy during a two-day meeting of the regulator on Wednesday. Experts believe that a serious increase in inflation may cause tougher actions by officials, and they will raise the rate more than four times in 2022. At the same time, it is unlikely that the current downturn in the stock markets will force the agency to soften its position. In these conditions, prerequisites are being created for the further strengthening of the USD against alternative assets.
Support and resistance
Resistance levels: 0.6780, 0.6835, 0.6958.
Support levels: 0.6592, 0.6500.
Strategy has been used here. icumuku or Moving Average and how does this formula work?
Medlem sedan Dec 08, 2021
330 inlägg
Jan 26, 2022 at 09:42
AliaDare posted:SolidECN posted:
NZD/USD
New Zealand Dollar under pandemic pressure
Current trend
This week, the NZD/USD pair continued to decline and reached three-month lows around 0.6645. The decline in the trading instrument is due to two main factors: the expectation of a serious tightening of monetary policy by the US Fed and the deterioration of the epidemiological situation in New Zealand.
In general, the country's economy is recovering moderately, as evidenced by December statistics: retail sales increased by 0.4%, and the business activity index in the manufacturing sector increased from 50.6 to 53.7 points, but in the near future it may be under pressure due to the increase in the incidence of the COVID-19 Omicron strain. Since Sunday, new quarantine restrictions have come into force, a mask regime is being introduced, and the work of public institutions is limited. These measures may create pressure on the service sector and slow down the economic recovery.
The USD now looks preferable to its New Zealand competitor, as investors expect decisive action from the US Fed. The agency may announce plans to adjust monetary policy during a two-day meeting of the regulator on Wednesday. Experts believe that a serious increase in inflation may cause tougher actions by officials, and they will raise the rate more than four times in 2022. At the same time, it is unlikely that the current downturn in the stock markets will force the agency to soften its position. In these conditions, prerequisites are being created for the further strengthening of the USD against alternative assets.
Support and resistance
Resistance levels: 0.6780, 0.6835, 0.6958.
Support levels: 0.6592, 0.6500.
Strategy has been used here. icumuku or Moving Average and how does this formula work?
Hello and thank you for your comment.
Fundamental analysis is the pillar of our daily analysis, indicators comes second. We will do our best to start a new topic for teaching the strategy.
Solid ECN, a True ECN Broker
Medlem sedan Dec 08, 2021
330 inlägg
Jan 26, 2022 at 10:51
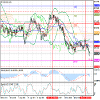
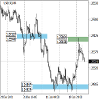
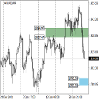
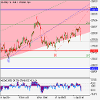
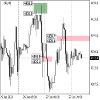
EUR/USD
US Fed meeting results determine the dynamics of the pair
Current trend
This week, the EUR/USD pair actively fell due to the strengthening of the American currency, currently trading around 1.129.
The dollar is rising as investors await the outcome of the first meeting of the US Federal Reserve this year, which will end today. It is predicted that officials of the department will leave the rate at the same level in January but will announce their readiness to raise it in March. Most experts believe that to combat inflation, which was fixed at 7.0% for December, the regulator may need four or more adjustments this year. Another issue will be the reduction of the department's balance sheet, which has more than doubled during the pandemic. Most likely, the process will be launched as early as May or June after completing the emergency asset purchase program. In general, the market is tuned to the "hawkish" rhetoric of the US Federal Reserve, which, in turn, should contribute to further strengthening of the US currency but may create additional pressure on the stock market.
Support and resistance
The consolidation below 1.1290 allows the EUR/USD pair to decrease to 1.1230 - 1.1185 . The key "bullish" level is 1.1350, Fibonacci correction, 23.6%, the middle line of Bollinger bands, which breakout will become a catalyst for upward dynamics to the area of 1.1470 , Fibonacci correction 38 .2%. The indicators do not give a single signal: Bollinger bands are horizontal, the MACD histogram is near the zero line, its volumes are insignificant, and Stochastic reverses upwards.
Resistance levels: 1.1350, 1.1413, 1.1475.
Support levels: 1.1290, 1.1230, 1.1185.
Bilagor:
Solid ECN, a True ECN Broker
Medlem sedan Dec 08, 2021
330 inlägg
Jan 26, 2022 at 11:51
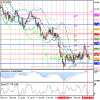
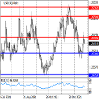
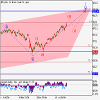
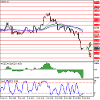
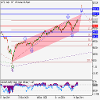
USD/JPY
The instrument is preparing to continue growing
Current trend
At the beginning of the current trading week, the USD/JPY pair corrected to January's low around 113.50 but stopped the decline and is now regaining lost positions in anticipation of the US Federal Reserve rate decision.
It is expected that in January, the agency will leave the parameters of monetary policy at the same level and the rate at 0.25%. However, forecasts for the near future will be extremely important for the market. As a result of the January meeting, which will end on Wednesday, the US regulator may signal to the markets that it is ready to start raising interest rates in March to combat rising inflation in the country. Traders are taking a cautious stance ahead of today's publication of the agency's decision at 21:00 (GMT+2) and the subsequent press conference at 21:30 (GMT+2), hoping that officials' rhetoric will allow the asset to break out of the 114.10–113.50 range. If the expectations of tightening monetary policy come true, then the strengthening of the positions of the US dollar is expected, and, consequently, the instrument may grow to the levels of 115.40 and 116.10.
Support and resistance
The long-term trend in the asset is upwards, with the targets at 115.40 and 116.10. To start a new upward, traders need to break through the resistance level of 114.10.
The medium-term trend is upwards. This week, the USD/JPY pair renewed the low of January 14 but failed to consolidate below it, so the growth of the trading instrument with the target at the level of 116.25 is supposed.
Resistance levels: 114.10, 115.40, 116.10.
Support levels: 113.50, 112.73, 111.95.
Bilagor:
Solid ECN, a True ECN Broker
Medlem sedan Dec 08, 2021
330 inlägg
Jan 26, 2022 at 14:49
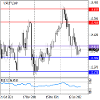
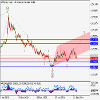
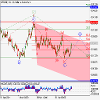
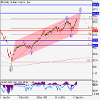
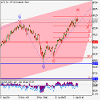
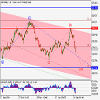
USD/CAD
Decline under pressure from rising oil prices
Current trend
After the USD/CAD pair couldn't break the resistance level of 1.2650, it resumed its downward dynamics to 1.2500. The pressure on the asset is exerted by the growth of quotations for WTI Crude Oil, which reached $86 per barrel. Further strengthening of the oil prices to 90.00 will contribute to the continued decline of the USD/CAD pair and allow the "bears" to reach the level of 1.2500.
The long-term trend in the USD/CAD pair is upwards. At the moment, a correction is developing, and the breakdown of 1.2500 allows reaching the key support near 1.2295.
The medium-term trend is downwards. This week, the pair corrected to the key resistance 1.2706–1.2683, which allowed the "bulls" to close positions at favorable prices, and the "bears" — to form new sales with the targets at the last week's lows. The breakout of the key resistance of the trend allows growth to the target zone 2 (1.2950–1.2926).
Support and resistance
Resistance levels: 1.2650, 1.2850, 1.2936.
Support levels: 1.2500, 1.2295, 1.2161.
Bilagor:
Solid ECN, a True ECN Broker
Medlem sedan Dec 08, 2021
330 inlägg
Jan 27, 2022 at 06:42
USD/CAD, Elliot Wave Analysis
The pair may grow.
On the daily chart, a downward correction developed as the wave of the higher level 4, and the development of the fifth wave 5 started, within which the wave (1) of 5 forms. Now, the third wave of the lower level 3 of (1) is developing, within which the wave i of 3 has formed, and a local correction has ended as the wave ii of 3. If the assumption is correct, the pair will grow to the levels of 1.3200–1.3410. In this scenario, critical stop loss level is 1.2446.
Bilagor:
Solid ECN, a True ECN Broker
Medlem sedan Dec 08, 2021
330 inlägg
Jan 27, 2022 at 09:52
USD/CHF, Elliot Wave Analysis
The pair is in a correction, a fall is possible.
On the daily chart, the first downward wave of the higher level (1) of 3 formed, and an upward correction developed as the second wave (2) of 3, within which the wave C of (2) formed. Now, the development of the third wave (3) of 3 has started, within which the first wave of the lower level i of 1 of (3) has formed, and the development of the local correction ii of 1 of (3) is ending. If the assumption is correct, after the end of the correction, the pair will fall to the levels of 0.8921–0.8758. In this scenario, critical stop loss level is 0.9373.
Bilagor:
Solid ECN, a True ECN Broker
Medlem sedan Dec 08, 2021
330 inlägg
Jan 27, 2022 at 14:55
The pound is under pressure from the results of the US Fed meeting
Currently, the pound is under pressure from the outcome of the US Fed meeting. The regulator, as expected, announced its intention to raise the interest rate on short-term loans by 0.25% in the near future, but the exact date was not announced, however experts continue to believe that this will happen in March. In addition, a reduction in the balance sheet of the US Fed was announced, which now significantly exceeds the required volume. Commenting on the current situation, the head of the regulator Jerome Powell noted that the recovery of the labor market and rising inflation suggest that the economy no longer needs serious stimulation. At the same time, the risks of a long delay in inflation at current levels and even its growth remain, but officials do not consider this scenario to be basic. In general, Powell's comments indicate the intention of the department to continue tightening monetary policy, which in the long term will support the US currency.
Resistance levels: 1.3550, 1.3672, 1.3732.
Support levels: 1.3427, 1.3366, 1.3306.
Bilagor:
Solid ECN, a True ECN Broker
Medlem sedan Dec 08, 2021
330 inlägg
Jan 27, 2022 at 15:55
Gold, correction before further growth
Current trend
Gold quotes are declining due to the rhetoric of the US Federal Reserve about the upcoming tightening of monetary policy and the intention of the regulator to fight inflation with the help of a consistent increase in interest rates.
As a result, the XAU/USD pair fell to the support level of $1812, but the uptrend continues. Investors have temporarily turned their attention to the US dollar. At the moment, there is an outflow of capital from the US stock market and the precious metals market. If the "bears" manage to break through the level of $1812, then the decline will continue to $1790. If the level of $1812 is held, the asset may rise to the high of the current week at the level of 1854.00.
Resistance levels: $1854, $1870, $1908.
Support levels: $1812, $1790, $1753.
Bilagor:
Solid ECN, a True ECN Broker
Medlem sedan Dec 08, 2021
330 inlägg
Jan 28, 2022 at 07:11
(redigerad Jan 28, 2022 at 07:37)
Brent Crude Oil, Elliot Wave Analysis
The price may grow.
On the daily chart, the upward wave C forms, within which the first wave 1 of (1) of C develops. Now, the fifth wave of the lower level v of 1 is forming, within which the wave (iii) of 1 is developing. If the assumption is correct, the price will grow to the levels of 100.00–115.00. In this scenario, critical stop loss level is 69.45.
Bilagor:
Solid ECN, a True ECN Broker
Medlem sedan Dec 08, 2021
330 inlägg
Jan 28, 2022 at 07:37
Gold, Elliot Wave Analysis
The pair may grow.
On the daily chart, the fifth wave of the higher level (5) develops, within which the first entry wave 1 of (5) formed, the correctional wave 2 of (5) developed, and the wave 3 of (5) forms. Now, the third wave of the lower level iii of 3 is developing, within which the wave (iii) of iii is forming. If the assumption is correct, the pair will grow within the wave to the levels of 1919.90–2067.60. In this scenario, critical stop loss level is 1752.82.
Bilagor:
Solid ECN, a True ECN Broker
Medlem sedan Dec 08, 2021
330 inlägg
Jan 28, 2022 at 10:14
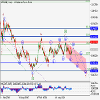
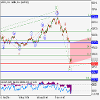
EUR/USD
The "bearish" sentiment in the asset is intensifying
Current trend
The European currency shows ambiguous dynamics of trading against the US dollar during today's Asian session, consolidating near the level of 1.1150. The day before, EUR/USD showed a steady decline, as a result of which it updated record lows from June 2, 2020.
The reason for the strengthening of "bearish" sentiment yesterday was the strong data on the dynamics of US GDP for Q4 2021. The official noted the achievements of the American economy and said that board members are considering a rate hike as early as March. Moreover, under certain circumstances, the regulator can adjust the rate by 50 basis points at once.
Today, investors will be focused on statistics on the dynamics of German GDP for Q4 2021. Also during the day there will be a report on business sentiment in the euro area for January.
Bollinger Bands in D1 chart demonstrate a stable decrease. The price range is expanding; however, it fails to catch the surge of the "bearish" sentiment at the moment. MACD is going down preserving a stable sell signal. Stochastic keeps a confident downward direction but is already approaching its lows, which indicates the risks of oversold EUR in the ultra-short term.
Resistance levels: 1.1185, 1.1220, 1.1255, 1.13.
Support levels: 1.113, 1.11, 1.1054, 1.1.
Bilagor:
Solid ECN, a True ECN Broker
Medlem sedan Dec 08, 2021
330 inlägg
Jan 28, 2022 at 13:37
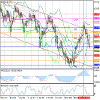
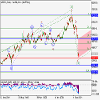
S&P 500
Trend change to downward
The S&P 500 has lost 9.7% from its peak this year and is likely to continue its downtrend amid an outflow of investor capital in anticipation of the upcoming tightening of the monetary policy by the US Federal Reserve.
The medium-term trend in the asset changed to a downtrend last week with reaching the target zone (4376-4354), which was broken this week, opening a new target for the "bears" at the target zone (4146-4123). The trend boundary is shifting to the area of 4550.0–4437.0, from where it is possible to search for new short positions.
The short-term trend is downward. Yesterday, market participants broke through the support zone 4345.9–4335.1, and now the target for sales is the target zone 4237–4216. In addition, the key trend resistance at 4389–4378 was tested the day before, which led to a new wave of sales.
Resistance levels: 4437, 4550, 4674
Support levels: 4223, 4123, 4050.
Bilagor:
Solid ECN, a True ECN Broker
Medlem sedan Jul 19, 2020
742 inlägg
Jan 31, 2022 at 01:21
SolidECN posted:
S&P 500
Trend change to downward
The S&P 500 has lost 9.7% from its peak this year and is likely to continue its downtrend amid an outflow of investor capital in anticipation of the upcoming tightening of the monetary policy by the US Federal Reserve.
The medium-term trend in the asset changed to a downtrend last week with reaching the target zone (4376-4354), which was broken this week, opening a new target for the "bears" at the target zone (4146-4123). The trend boundary is shifting to the area of 4550.0–4437.0, from where it is possible to search for new short positions.
The short-term trend is downward. Yesterday, market participants broke through the support zone 4345.9–4335.1, and now the target for sales is the target zone 4237–4216. In addition, the key trend resistance at 4389–4378 was tested the day before, which led to a new wave of sales.
Resistance levels: 4437, 4550, 4674
Support levels: 4223, 4123, 4050.
Very good analysis. Do you work as a mentor? If you can't learn trading, it will be really difficult.
Medlem sedan Dec 08, 2021
330 inlägg
Jan 31, 2022 at 06:53
WTI Crude Oil, Elliot wave analysis
The price may grow.
On the daily chart, the upward wave C forms, within which the first wave 1 of (1) of C develops. Now, the fifth wave of the lower level v of 1 of (1) is developing, within which the wave (iii) of 1 is forming. If the assumption is correct, the price will grow to the levels of 100.00–110.00. In this scenario, critical stop loss level is 75.
Bilagor:
Solid ECN, a True ECN Broker
Medlem sedan Dec 08, 2021
330 inlägg
Jan 31, 2022 at 07:26
AliaDare posted:SolidECN posted:
S&P 500
Trend change to downward
The S&P 500 has lost 9.7% from its peak this year and is likely to continue its downtrend amid an outflow of investor capital in anticipation of the upcoming tightening of the monetary policy by the US Federal Reserve.
The medium-term trend in the asset changed to a downtrend last week with reaching the target zone (4376-4354), which was broken this week, opening a new target for the "bears" at the target zone (4146-4123). The trend boundary is shifting to the area of 4550.0–4437.0, from where it is possible to search for new short positions.
The short-term trend is downward. Yesterday, market participants broke through the support zone 4345.9–4335.1, and now the target for sales is the target zone 4237–4216. In addition, the key trend resistance at 4389–4378 was tested the day before, which led to a new wave of sales.
Resistance levels: 4437, 4550, 4674
Support levels: 4223, 4123, 4050.
Very good analysis. Do you work as a mentor? If you can't learn trading, it will be really difficult.
Hello,
Thank you for your comment.
I'm afraid I can't post links here since it would be flagged by the admin as a commercial post. We have a YouTube channel with tutorial videos about trading forex and derivatives. Feel free to visit our profile to find more information.
Solid ECN, a True ECN Broker
Medlem sedan Dec 08, 2021
330 inlägg
Jan 31, 2022 at 09:02
Silver, Elliot Wave Analysis
The pair may fall.
On the daily chart, the first wave of the higher level (1) of 3 formed, and a downward correction develops as the wave (2) of 3. Now, the wave C of (2) is forming, within which the fifth wave of the lower level v of C is developing. If the assumption is correct, the price will fall to the levels of 20.53–18.34. In this scenario, critical stop loss level is 24.62.
Bilagor:
Solid ECN, a True ECN Broker
Medlem sedan Dec 08, 2021
330 inlägg
Jan 31, 2022 at 09:38
Netflix, Elliot Wave Analysis
The price may grow.
On the daily chart, the third wave of the higher level (3) formed. Now, a downward correction has formed as the fourth wave (4), within which the wave C of (4) has formed, which has reached the correctional level of 62%. If the assumption is correct, the price will grow to the levels of 507.54–702.06. In this scenario, critical stop loss level is 350.54.
Bilagor:
Solid ECN, a True ECN Broker