


GBP/USD shows recovery signs


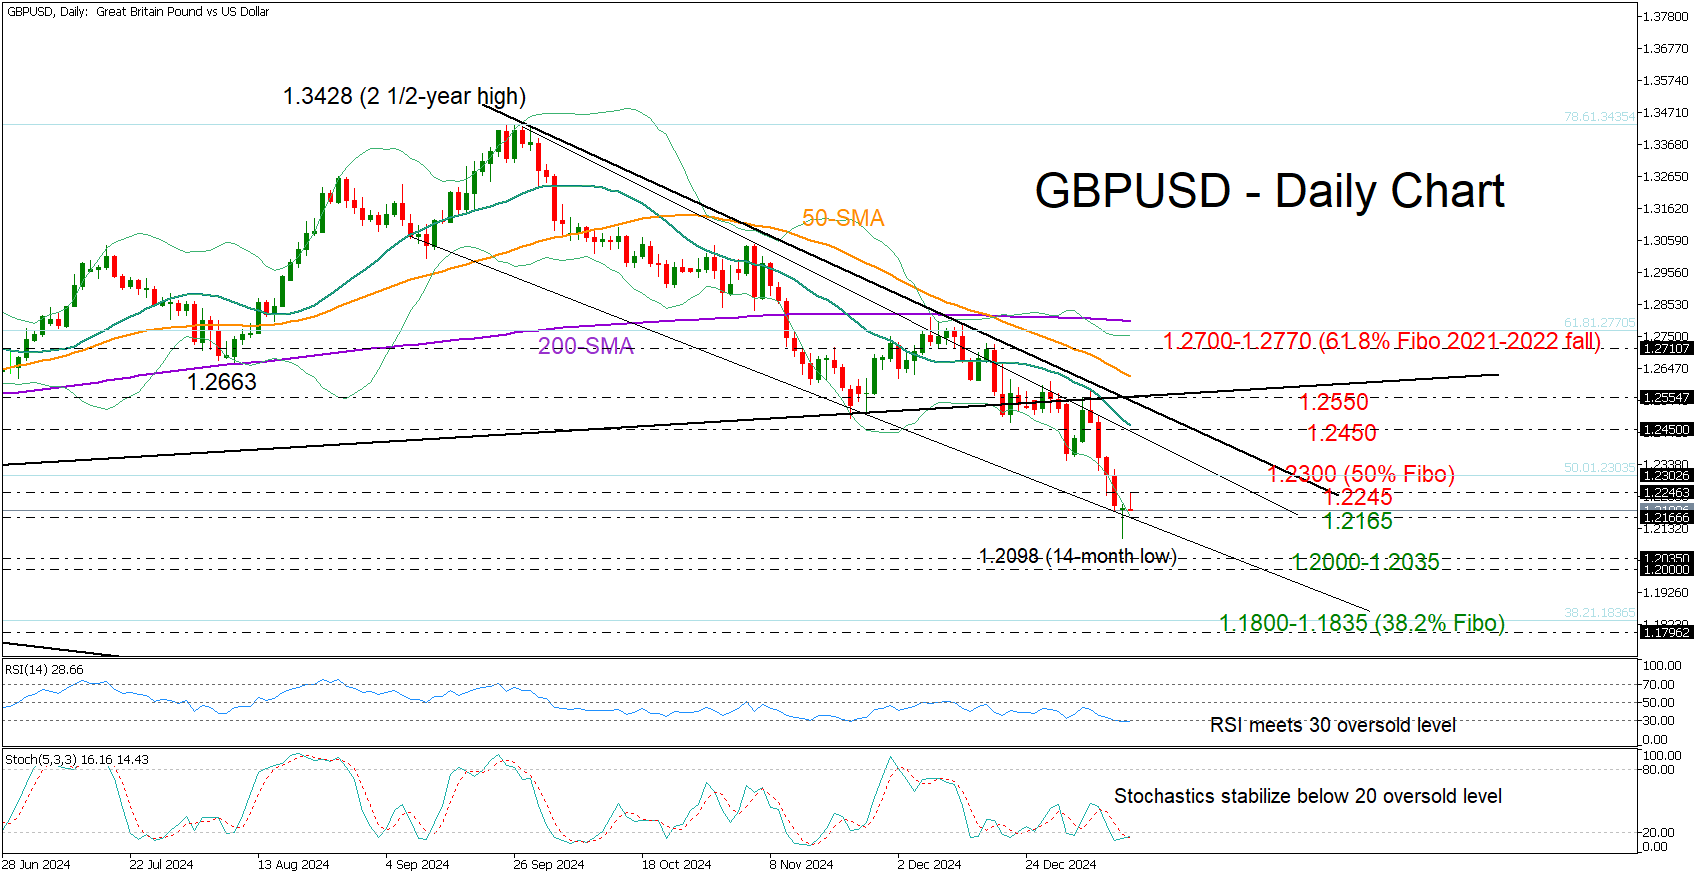
GBPUSD slumped to a 14-month low of 1.2098 on Monday following five devastating weeks, but a hopeful green doji candlestick emerged at the close of the day, signaling that the bears might be losing their grip.
The RSI and the stochastic oscillator are both flatlining near their oversold levels, and the price itself has dipped below the lower Bollinger band. These signs suggest that the recent bearish cycle might have hit a bottom, though traders will likely want confirmation before committing to buying positions.
The 1.2245 level is currently capping bullish momentum, while slightly higher, the 1.2300 number represents the 50% Fibonacci retracement of the sharp 2021-2022 downtrend and could be symbolic. A move above the latter could allow more increases toward the crucial 20-day simple moving average (SMA) at 1.2450, which rejected the bulls twice recently. From there, the bulls could fight for a close above the tentative resistance trendline from September seen at 1.2550. A successful penetration higher could attract new buyers, delivering an acceleration toward the 1.2700 area, if the 50-day SMA gives way as well.
In the opposite case where the price closes below 1.2165, the spotlight will turn again to the 1.2100 level and if this proves easy to breach this time, the bears could target the October 2023 low of 1.2035 and the 1.2000 psychological number. Additional losses from there could target the 38.2% Fibonacci level of 1.1835 or even the 2023 base around 1.1800.
Overall, GBPUSD is showing signs of a potential recovery after its steep fall, particularly if it manages to break above the 1.2235-1.2300 range. For a more sustained upward move and a brighter outlook, the pair would need to establish a solid base above 1.2550, paving the way for a longer-term bullish trend.
.jpg "GBP/USD shows recovery signs")

Gold, GBPUSD, EURUSD

Dollar Strengthens as Global Rate Cut Bets Fade | 17th November 2025

Trump retreats, dollar advances

Trump retreats, dollar advances

ATFX Market Outlook 17th November 2025

GBP/USD Mired at Seven-Month Lows Amid Political and Fiscal Concerns

The dollar emerging from the data fog


