


Advertisement
Swing Trading Analysis & Results

เป็นสมาชิกตั้งแต่ Nov 19, 2014
157 โพสต์
Aug 08, 2015 at 19:29
(แก้ไขแล้ว Aug 08, 2015 at 19:31)
Hey guys, how´s the trading going?
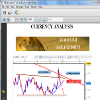
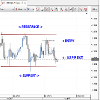
The Bear Crown/Head and Shoulders pattern is very common across the Forex and is one of those that leads to strong reversals.
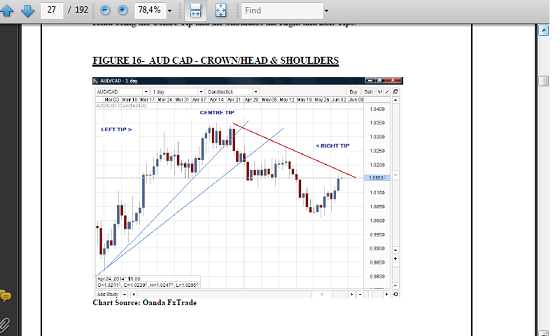
Based on what is taking place on the EURO AUD, we may already have the Left Tip and Centre Tip already formed. If we see a Right Tip, it would represent the start of reversal. This would lead to a Downtrend that is needed to complete the Range Setup taking shape on the Daily Chart.
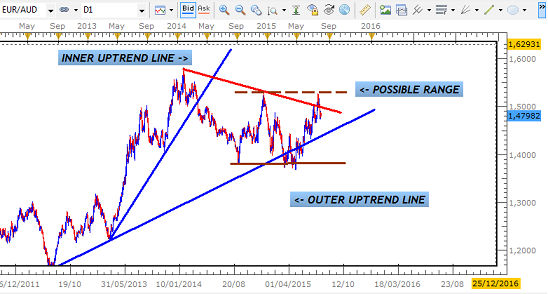
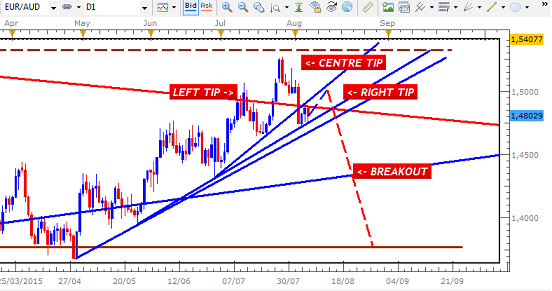
If we get a strong breakout below the Uptrend Lines, Setups and Signals that provide 200 Pips within this expected 1000 Pip drop, are likely to be there for the taking.
Duane
DRFXTRADING
ไฟล์แนบ :

Trade Less, Earn More
Aug 17, 2015 at 08:26
This has been the most helpful forum post considering it is in alignment to my trading method (swing trading). I'm still a newbie trading on demo though. Yet to iron out some things like trading breakout, and figuring entry signals. Thanks a lot Duane, keep posting, you have no idea how many are learning from you. :-)😎

เป็นสมาชิกตั้งแต่ Oct 11, 2013
769 โพสต์
Aug 18, 2015 at 06:27
Very good charts and explanations, indeed. Nice way to box the prices and determine possible breakouts.
เป็นสมาชิกตั้งแต่ Nov 19, 2014
157 โพสต์
Aug 23, 2015 at 19:14
Thanks NjanFX, alexforex,
This method is very powerful not just for Swing Traders but for Day Traders.
The power of these patterns can be applied to all time frames and are a good complement to other techniques that people already use..indicators etc.
This method is very powerful not just for Swing Traders but for Day Traders.
The power of these patterns can be applied to all time frames and are a good complement to other techniques that people already use..indicators etc.
Trade Less, Earn More
เป็นสมาชิกตั้งแต่ Nov 19, 2014
157 โพสต์
Aug 30, 2015 at 19:10
(แก้ไขแล้ว Aug 30, 2015 at 19:38)
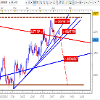
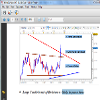
......Yet another example of how Consolidation Breakouts with Large Candles lead to False Breakouts....another trap of the market..
EURO USD looked set to break higher with this Large Candle...
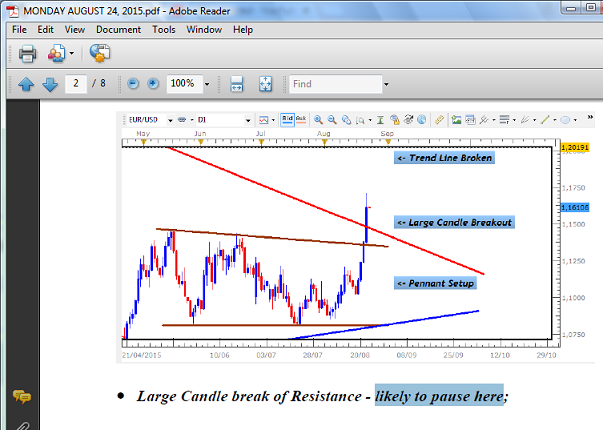
...but I expected it to at least pause before either moving sideways or reversing sharply....
This is because these Large Candles, as attractive as they are, hardly lead to successful breakouts.
Figuring this out and identifying the types of Candles that actually lead to profitable breaks was what I had to do...
I cant tell how much money was lost and time spent in spotting the right signals to trade- made a big difference in results.
Although this has taken place on the Daily Chart, these Large Candles are seen across all time frames as well. Its not so much the size in terms of Pips but relative to the other Candles on the time frame being traded. So whether you are a Day or Swing Trader, they will appear from time to time.
Once you can make this distinction, it becomes much easier to avoid these traps.
&feature=youtu.be
Duane
DRFXTRADING

EURO USD looked set to break higher with this Large Candle...
...but I expected it to at least pause before either moving sideways or reversing sharply....
This is because these Large Candles, as attractive as they are, hardly lead to successful breakouts.
Figuring this out and identifying the types of Candles that actually lead to profitable breaks was what I had to do...
I cant tell how much money was lost and time spent in spotting the right signals to trade- made a big difference in results.
Although this has taken place on the Daily Chart, these Large Candles are seen across all time frames as well. Its not so much the size in terms of Pips but relative to the other Candles on the time frame being traded. So whether you are a Day or Swing Trader, they will appear from time to time.
Once you can make this distinction, it becomes much easier to avoid these traps.
&feature=youtu.be
Duane
DRFXTRADING
ไฟล์แนบ :
Trade Less, Earn More
เป็นสมาชิกตั้งแต่ Nov 19, 2014
157 โพสต์
Sep 28, 2015 at 17:33
(แก้ไขแล้ว Sep 28, 2015 at 17:53)
Trading opportunity on the NZD CAD to head back down to Support withing the Daily Chart´s Range Setup.
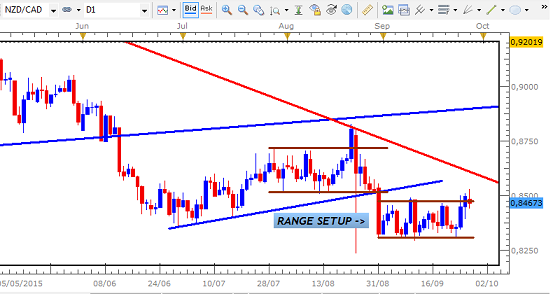
We would be looking to trade this using a signal on the 4 Hour Chart.
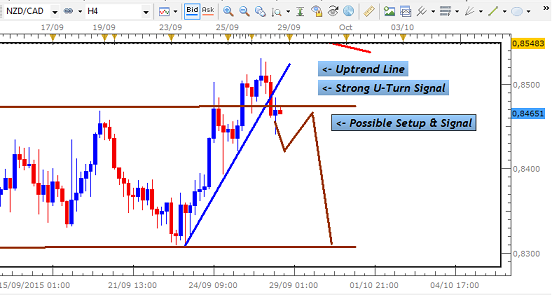
Strong Bearish Signal has been given at Resistance, but not enough to start the move.
We gonna need either an ABC or Bear Crown/head and shoulders pattern to get going.
Duane
DRFXSWINGTRADING
We would be looking to trade this using a signal on the 4 Hour Chart.
Strong Bearish Signal has been given at Resistance, but not enough to start the move.
We gonna need either an ABC or Bear Crown/head and shoulders pattern to get going.
Duane
DRFXSWINGTRADING
ไฟล์แนบ :
Trade Less, Earn More
เป็นสมาชิกตั้งแต่ Nov 19, 2014
157 โพสต์
Nov 04, 2015 at 23:01
Hey all, been awhile, back with you.
These Videos will now show you examples of a more aggressive Swing Trading approach based on my current Methodology. They will show how you can take advantage of profitable movements in the market each week that can provide an average of 150 Pips per trade. As long as you know which trading rule to apply to the trading opportunity presented, you will be able to profit from these trades on a consistent basis every month.
There are now 5 Swing Trading Strategies that I use which will be showcased here which you can easily apply to your trading.
1. Trading Within Consolidation using Support and Resistance
2. Trading Within Consolidation using Daily Chart Signals
3. Trading Within Consolidation using 4 Hour Chart Signals
4. Trading Strong Trends/Consolidation Breakouts
5. Trading Slow Trends/Consolidation Breakouts
As Swing Traders using Price Action/Candlestick Signals, a big challenge when Trading within Consolidations is figuring out which time frame to use for entry or if we should simply enter at the S/R areas. There are several Technical Factors that determine which strategy to use but one of them has to do with the size of the Consolidation. For small ones such as in the Video below, volatility at the S&R areas is minimal, making it easier for us to enter there without waiting on the Candlestick Signals. For larger Consolidations, however, Daily and 4 Hour Chart Signals have to be used given the increased volatility/spikes at these areas.
There are some Trends and Consolidation Breakouts that are very fast and are characterized by Strong, Large Candles while others have Small, Slow Candles. These require 2 Types of Trading Strategies to ensure we aren't affected by unexpected pullbacks that lead to losses.
These Trades will also be shown in the Dukascopy Trader Contest to show how they perform under a competitive environment. By targeting an average of 150 Pips per trade twice a week, it is possible to generate 1200 Pips each month - very large turnover that can provide strong Short Term and Long-Term Gains.
Any questions and comments, fire away.
102 PIPS GBP CAD - TRADING WITHIN CONSOLIDATION USING SUPPORT AND RESISTANCE

&feature=youtu.be
Regards
Duane
DRFXSWINGTRADING
These Videos will now show you examples of a more aggressive Swing Trading approach based on my current Methodology. They will show how you can take advantage of profitable movements in the market each week that can provide an average of 150 Pips per trade. As long as you know which trading rule to apply to the trading opportunity presented, you will be able to profit from these trades on a consistent basis every month.
There are now 5 Swing Trading Strategies that I use which will be showcased here which you can easily apply to your trading.
1. Trading Within Consolidation using Support and Resistance
2. Trading Within Consolidation using Daily Chart Signals
3. Trading Within Consolidation using 4 Hour Chart Signals
4. Trading Strong Trends/Consolidation Breakouts
5. Trading Slow Trends/Consolidation Breakouts
As Swing Traders using Price Action/Candlestick Signals, a big challenge when Trading within Consolidations is figuring out which time frame to use for entry or if we should simply enter at the S/R areas. There are several Technical Factors that determine which strategy to use but one of them has to do with the size of the Consolidation. For small ones such as in the Video below, volatility at the S&R areas is minimal, making it easier for us to enter there without waiting on the Candlestick Signals. For larger Consolidations, however, Daily and 4 Hour Chart Signals have to be used given the increased volatility/spikes at these areas.
There are some Trends and Consolidation Breakouts that are very fast and are characterized by Strong, Large Candles while others have Small, Slow Candles. These require 2 Types of Trading Strategies to ensure we aren't affected by unexpected pullbacks that lead to losses.
These Trades will also be shown in the Dukascopy Trader Contest to show how they perform under a competitive environment. By targeting an average of 150 Pips per trade twice a week, it is possible to generate 1200 Pips each month - very large turnover that can provide strong Short Term and Long-Term Gains.
Any questions and comments, fire away.
102 PIPS GBP CAD - TRADING WITHIN CONSOLIDATION USING SUPPORT AND RESISTANCE
&feature=youtu.be
Regards
Duane
DRFXSWINGTRADING
ไฟล์แนบ :
Trade Less, Earn More
เป็นสมาชิกตั้งแต่ Nov 19, 2014
157 โพสต์
Nov 05, 2015 at 12:44
OBEYING THE HOLDING PERIOD RULES FOR TRADES
There is nothing more frustrating than seeing a strong floating profit turn into a loss in a matter of minutes. This can be avoided by establishing and obeying a rule for how long you hold your trades before deciding to close them. Sticking to this rule will help to minimize the losses due to holding out for more Pips than the market is going to give us.
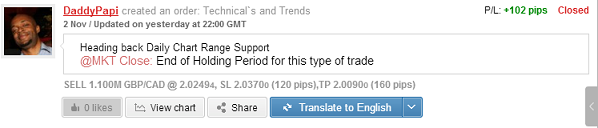
This recent trade on the GBP CAD which had to be closed at the end of my Holding Period for this type of trade shows how crucial this rule is to trading success, given the sharp reversal that took place right after exiting the trade.
Once you obey this rule, consistent gains will be a regular part of your trading.
Duane
DRFXSWINGTRADING
There is nothing more frustrating than seeing a strong floating profit turn into a loss in a matter of minutes. This can be avoided by establishing and obeying a rule for how long you hold your trades before deciding to close them. Sticking to this rule will help to minimize the losses due to holding out for more Pips than the market is going to give us.
This recent trade on the GBP CAD which had to be closed at the end of my Holding Period for this type of trade shows how crucial this rule is to trading success, given the sharp reversal that took place right after exiting the trade.
Once you obey this rule, consistent gains will be a regular part of your trading.
Duane
DRFXSWINGTRADING
Trade Less, Earn More
เป็นสมาชิกตั้งแต่ Nov 19, 2014
157 โพสต์
Nov 06, 2015 at 22:34
(แก้ไขแล้ว Nov 06, 2015 at 22:34)
GBP USD - BEARISH BREAKOUT FROM PENNANT OR BULLISH REVERSAL?
Hey guys,
We have a scenario now on the GBP USD where the Support of its Pennant on the Daily Chart is now taking place. Based on the theory of Consolidations, it could either continue Bearish or reverse to take us back inside of the Pennant.
&feature=youtu.be
There are certain technical factors and signals that tell us which of these 2 scenarios will take place and once you know what these are, you`ll be able to trade them profitably every time. This helps to avoids situations such as:
1- Jumping into the market at the first sign of a break of the Pennant only to see the market reverse sharply back inside.
2 - Start trading when we see the market showing signs of heading back inside of the Pennant only to see it U-Turn sharply to continue the breakout.
Both cause losses on a regular basis for traders, but they can be minimized once we know what those factors are that predict which situation will be the correct one.
Duane
DRFXTRADING[
Trade Less, Earn More
เป็นสมาชิกตั้งแต่ Nov 19, 2014
157 โพสต์
Nov 06, 2015 at 22:37
After forming the Pennant Setup on its Daily Chart as predicted several weeks ago, the CHF JPY pair could provide us with a trade in the next couple of days.
We will either see it head back inside of the Pennant and take us to Resistance or U-Turn at Support to continue the Bearish Breakout.
If it gives a Bull Candle to start the reversal, it would be an ABC Signal, which as you know leads to Sharp Movements and is a common signal seen when it comes to False Breakouts. If it continues bearish however, it would have to give us a strong Bear Candle that breaks the Counter Trend Line just below Support. Many times when a Consolidation is being broken, we will see the pair breakout initially, then pullback to test the broken S/R before U-Turning.
Once we get a signal in either direction, we are likely to be able to capture at least 150 Pips as long as the setup we see on the Daily & 4H Charts meet our entry rules.
So by Wednesday the latest we should see a signal to get things going.
Get ready to trade it!
Duane
DRFXTRADING
Trade Less, Earn More

เป็นสมาชิกตั้งแต่ Oct 02, 2014
905 โพสต์
Nov 07, 2015 at 10:21
Interesting to see developments.
Positivity
เป็นสมาชิกตั้งแต่ Nov 19, 2014
157 โพสต์
Nov 10, 2015 at 14:52
(แก้ไขแล้ว Nov 10, 2015 at 15:07)
Hey guys, just want to give my opinion on how to go about Forex...whether as a new person or someone currently trading but experiencing losses and looking for help..
1. Determine how much money you want to make for FX to be worth your time..
- many times people jump into FX without knowing what they want from it. This then leads to experimentation for a longer time than is necessary and with the 1000s of strategies out there, you can easily get lost and frustrated.
2. Find out what Methodology/style of Trading will get you that $$ goal.
- if there is a strategy out there that can get you what you are looking for, there is no need to reinvent the wheel. If there isnt one, then develop a strategy for yourself. Either way, practice the strategy on a Demo and ENSURE that it hits your targets for 3- 6 Months before going Live.
3. Do not rely on FREE or low cost trading information or strategies. The reason that most of them are Free and cost very little is that they are not providing anything new /worthwhile to improve your trading. Most of it is recycled information or information which just focus on one aspect of trading. Although most of them are useful by themselves, they cannot be expected to provide you with a complete/PROFITABLE trading plan.
4. Contrary to popular opinion, there is no point in trading Live without a plan. The only REAL difference with Live Trading is that your nerves can affect you more. But like many things in life, once you have prepared, practiced and worked out all the kinks, your performance in a simulated environment will be mirrored come game time.
5. Create a detailed trading plan with guidelines in place to ensure you do not become indisciplined. This will guide you especially when trading Live when it really matters
- for example, I use and tell people to have a holding period rule when trading. This ensures that you dont become greedy. If the market is only going to give you 150 Pips on a trade you must not try to hold on for 200 Pips just because you want to make up for a previous loss. If you do, the market will pullback to take away your gains, causing even more frustration. Take this recent trade on the GBP CAD made last week. As you will see in the Video, by holding on to the trade for even a few minutes or hours than you should can lead to losses in the blink of an eye.
6. Be patient, stick with your Trading Plan and never lose your cool.
Regards
Duane
Trade Less, Earn More
เป็นสมาชิกตั้งแต่ Nov 19, 2014
157 โพสต์
Nov 16, 2015 at 20:38
Hey everyone,
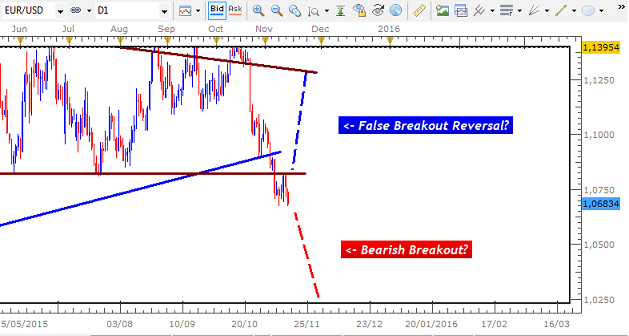
This pair looks to have broken the Support of the large Pennant on its Daily Chart at 1,0815..
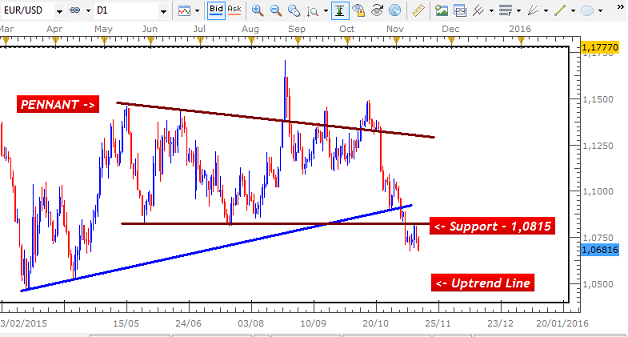
From here, it will either continue lower in favour of the USD or reverse to head back inside the Pennant.
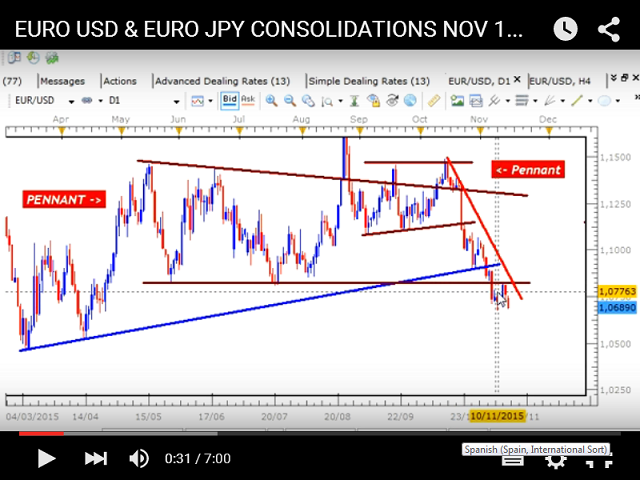
&feature=youtu.be
Ultimate direction is going to depend on the signal we get on the Daily Chart - either way, it will be very profitable as breakouts from Consolidations and False Breakout Reversals are usually fast, providing large Pips in a short time.
Duane
DRFXSWINGTRADING
This pair looks to have broken the Support of the large Pennant on its Daily Chart at 1,0815..
From here, it will either continue lower in favour of the USD or reverse to head back inside the Pennant.
&feature=youtu.be
Ultimate direction is going to depend on the signal we get on the Daily Chart - either way, it will be very profitable as breakouts from Consolidations and False Breakout Reversals are usually fast, providing large Pips in a short time.
Duane
DRFXSWINGTRADING
Trade Less, Earn More
เป็นสมาชิกตั้งแต่ Nov 19, 2014
157 โพสต์
Nov 21, 2015 at 22:38
(แก้ไขแล้ว Nov 21, 2015 at 22:43)
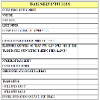
DO YOU GET NERVOUS WHEN TRADING?
If so, my advice is to ensure you have a Trading Plan Trade Sheet.
I used to be nervous too especially trading smaller time frames. These move very quickly and the minute you enter a trade, there is a possibility to lose very quickly - not a nice feeling. You get a lot of unnecessary tension and nerves. This is one of the many reasons I and others switched to the larger time frames and Swing Trading.
Nevertheless, whatever time frame you use..get a Trade Sheet that has rules and checklists to justify each trade. I found that whenever I traded without this, I would be unsure if I had taken everything into account before clicking that button. This uncertainty creates anxiety and fear.
If you have a Trade Sheet that you know will provide you with a good trade 80-90% of the time, you will be more confident. It gives you a visual confirmation that you are making the right decision and that everything has been accounted for.
This is what I use.
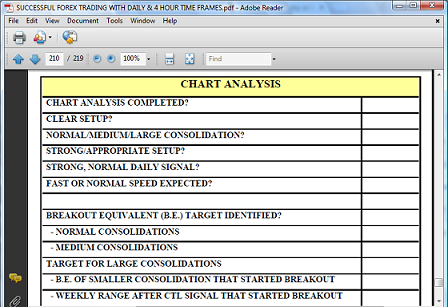
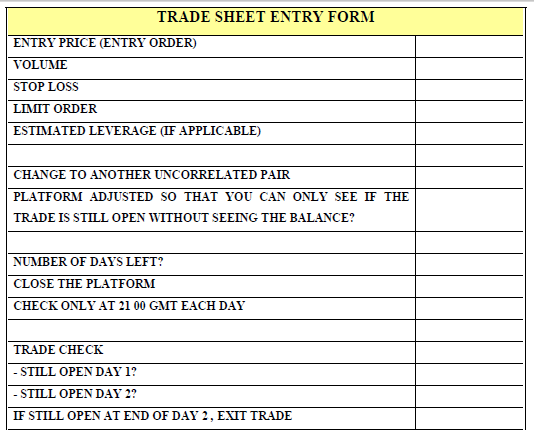
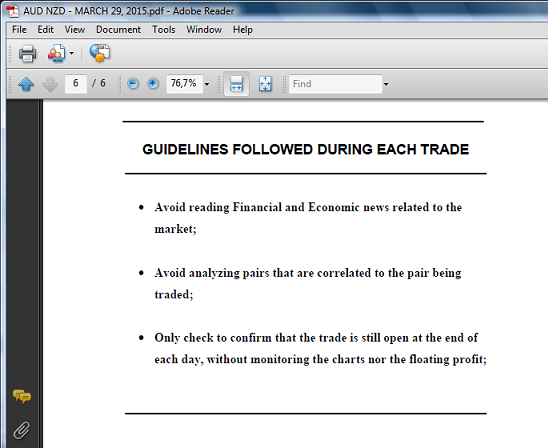
This guides me through all steps involved in the trade - from analysis to closing of the trading platform as well as while the trade is in motion.
If you use something like this during Demo Account phase and the results are good, then just use it on the Live Account and the nerves will fade away and be replaced by celebration of trading wins.
Good luck
Duane
DRFXSWINGTRADING


If so, my advice is to ensure you have a Trading Plan Trade Sheet.
I used to be nervous too especially trading smaller time frames. These move very quickly and the minute you enter a trade, there is a possibility to lose very quickly - not a nice feeling. You get a lot of unnecessary tension and nerves. This is one of the many reasons I and others switched to the larger time frames and Swing Trading.
Nevertheless, whatever time frame you use..get a Trade Sheet that has rules and checklists to justify each trade. I found that whenever I traded without this, I would be unsure if I had taken everything into account before clicking that button. This uncertainty creates anxiety and fear.
If you have a Trade Sheet that you know will provide you with a good trade 80-90% of the time, you will be more confident. It gives you a visual confirmation that you are making the right decision and that everything has been accounted for.
This is what I use.
This guides me through all steps involved in the trade - from analysis to closing of the trading platform as well as while the trade is in motion.
If you use something like this during Demo Account phase and the results are good, then just use it on the Live Account and the nerves will fade away and be replaced by celebration of trading wins.
Good luck
Duane
DRFXSWINGTRADING
ไฟล์แนบ :
Trade Less, Earn More
เป็นสมาชิกตั้งแต่ Nov 19, 2014
157 โพสต์
Nov 22, 2015 at 12:58
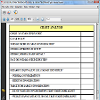
DETERMINING YOUR PIP TARGET PER TRADE
Take a Top - Down Approach.
1. Determine how much Money you need to make from Trading to make it worth it. (ex. $1000 Monthly)
2. Determine how much you are going to invest in a Real Account. ($1000)
3. 1 and 2 will give you your expected Rate of Return per month - 100%
4. Determine if you can/want to trade every day or a few days during the month - Day vs Swing Trading
5. After choosing, determine how many times per month on average yu will trade. (ex. 10 times)
6 . This then gives you the average dollar amount per trade you need to get to that $1000 per month - $100
7 . Then use this $100 along with the risk per trade (ex. 5%) to determine the Risk/Reward Ratio per trade you need.
- If you risk 5% per trade ($50) then you need a strategy that gives you a 2 to 1 Reward Ratio ($100/$50) on average
Naturally, as your account balance increases/decreases, the dollar amount of the gain per trade will change.
This approach takes the uncertainty out of how many Pips to get per trade since you now know the bigger picture. The challenge is then to determine which trading strategy can get you this consistently.
Duane
DRFXSWINGTRADING
Trade Less, Earn More

forex_trader_139412
เป็นสมาชิกตั้งแต่ Jul 16, 2013
352 โพสต์
Nov 22, 2015 at 21:33
Very detailed analysis of what you are doing - 10/10. I can only find a demo account based on this trading style, and some accounts that went belly up. I assume you have a showcase/real account that you are not showing? Otherwise on what grounds should your analysis be taken seriously? The fact that it does well on demo?
เป็นสมาชิกตั้งแต่ Nov 19, 2014
157 โพสต์
Nov 22, 2015 at 22:14
(แก้ไขแล้ว Nov 22, 2015 at 22:30)
Hmm..not sure if you are complementing me and/or criticizing me.
Yes I have a Live Account but I am "hiding" it...you got me..guilty.
If you check the Discuss section of that Demo Account (Swing Trading 1), you will see these trades were done on my Live Account at Dukascopy -(see the top of the graph which says "Live")
http://www.myfxbook.com/community/trading-systems/swing-trading-part-1/859880,2#?pt=2&p=1&ts=11&o=859880
Ideally, it would have been great to show this Live performance here to "prove" that this System works but unfortunately, the JForex Platform that Dukascopy uses cannot be tracked and verified by Myfxbook.
This is why I put the graphs of the Live Trades together with the Demo System to show that whats been happening on the Demo is also taking place on a Live Account.
So naturally, until Dukascopy`s platform can be tracked, I will just be showing individual trades. The Demo Account is no longer being used.
Trade Less, Earn More
forex_trader_139412
เป็นสมาชิกตั้งแต่ Jul 16, 2013
352 โพสต์
Nov 22, 2015 at 22:30
(แก้ไขแล้ว Nov 22, 2015 at 22:31)
No criticism....if there is a live account that we can all happily follow and trust we will make good $ by following your methods, as they are backed up by your real account.
I am sorry, but during my time in forex forums, I have become very sceptical and adopted a very "show us the money" attitude.
If you can do this I am sure you will gain the trust and attention of many.
I am sorry, but during my time in forex forums, I have become very sceptical and adopted a very "show us the money" attitude.
If you can do this I am sure you will gain the trust and attention of many.


