


Advertisement
Market Manipulation?

forex_trader_169700
Dec 30, 2013からメンバー
163 投稿
Oct 17, 2016 at 09:58
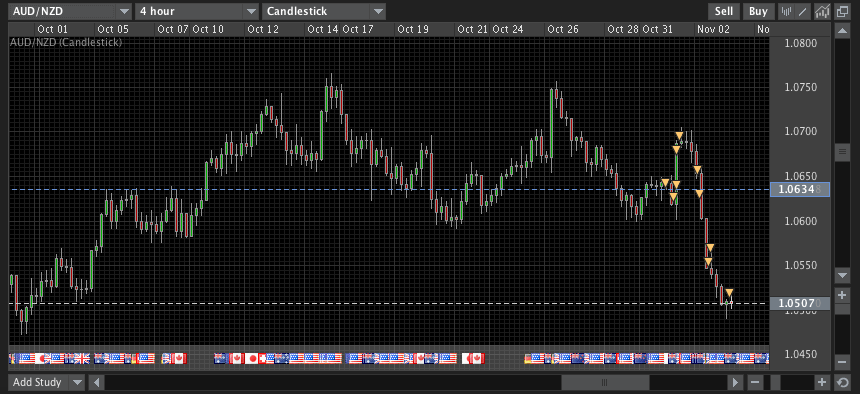
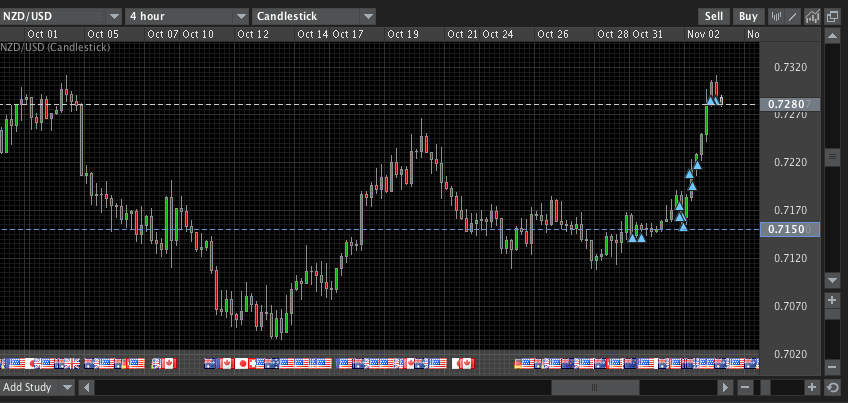
Looks like market manipulation to me!!! Any views?


forex_trader_169700
Dec 30, 2013からメンバー
163 投稿
Nov 02, 2016 at 08:16
Hi Flabrune
I'm using my own concoction of Parabolic and Moving Averages.
1. Open up blank chart.
2. Place Parabolic on chart.
3. Right Click on Chart and go to Indicators List.
4. In Indicators List, highlight Parabolic and Edit.
5. Change Colour if required and then go to Width and go to 2.
6. Place 1 Day Smooth Moving Average On Chart.
7. Again Right Click on Chart and go to Indicators, highlight Moving Average and Edit.
8. Apply to First Indicator's Data.
9. Place 5 Day Smooth Moving Average on chart and any other MA's you may want.
10. Right Click on Chart, go to Template and Save Template. In File name save as: pma.tpl so you can open and apply it on any chart.
11. If you want to use the template again, right click on chart and go to Template and you will see it listed.
How to use:
Draw trend lines through the 5 day Smooth Moving Average and where it crosses the parabolic between the High parabolic and the low parabolic. Start from the monthly and work backwards. See charts examples. Please note I have not put all the trend lines.
forex_trader_169700
Dec 30, 2013からメンバー
163 投稿
Nov 02, 2016 at 09:37
Please note: Draw horizontal lines where Moving Average Crosses Parabolic as these provide support and resistance.

Nov 02, 2016 at 09:56
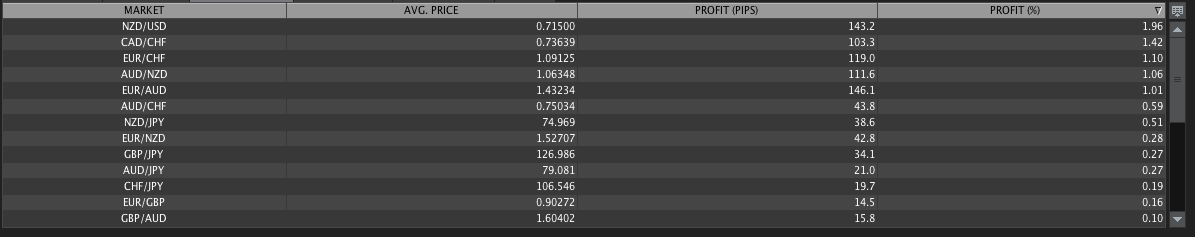
The markets are openly manipulated.
Several large banks have now paid fines for anything from interest rate to gold fixes. DB is facing a $15 billion fine which will send them into insolvency.
Gold is the worst, probably manipulated at top government level.
There's no mystery here. Markets are continuously and openly manipulated at the highest level.

Nov 02, 2016 at 12:53
Hi Tony I just saw your charts especially the last ones. Just an advice from my side , you are using way too much indicators and trend lines, the pure candles and price action is not getting seen and it will start to confuse you sooner or later. You should use lesser trend lines. Hope you see and understand my point someday . trading is hard anyway don’t make it even harder. Cheers
forex_trader_169700
Dec 30, 2013からメンバー
163 投稿
Nov 02, 2016 at 14:42
Hi Baldo
I agree, but I'm getting use to it now. I wish I could, my monitors are 24'', to be honest I need monitors the size of my lounge!!! I've got so many charts up, it's unbelievable, just so that I can double check everything. Thanks for the advice.
I agree, but I'm getting use to it now. I wish I could, my monitors are 24'', to be honest I need monitors the size of my lounge!!! I've got so many charts up, it's unbelievable, just so that I can double check everything. Thanks for the advice.

Jun 28, 2015からメンバー
9 投稿
Nov 03, 2016 at 07:33
I am so confused by what Greggy is implying or concluding here. You are making up your own indicators that illustrate what? your self described as "inexperienced" & have only demo accounts show that have consistently and quickly met a disastrous fate. I'm not uber experienced, but...
Cut it while it's hot.

forex_trader_29148
Feb 11, 2011からメンバー
1768 投稿
Nov 03, 2016 at 07:35
witch broker?
forex_trader_169700
Dec 30, 2013からメンバー
163 投稿
Nov 03, 2016 at 07:46
What system or algorithm are you using?
forex_trader_169700
Dec 30, 2013からメンバー
163 投稿
Nov 03, 2016 at 07:46
theHand posted:
Here's another one. Not a moments thought given to which way it was going to go.
What system or algorithm are you using?


