Edit Your Comment
Market Manipulation?

forex_trader_169700
Členom od Dec 30, 2013
163 príspevkov
Oct 17, 2016 at 09:58
Členom od Dec 30, 2013
163 príspevkov
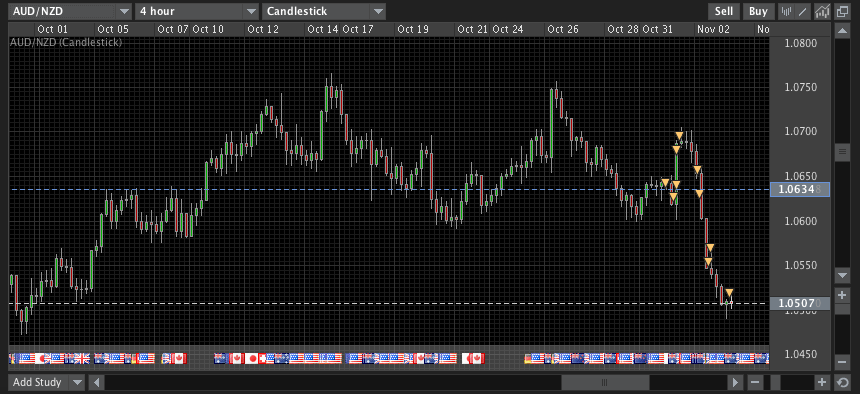
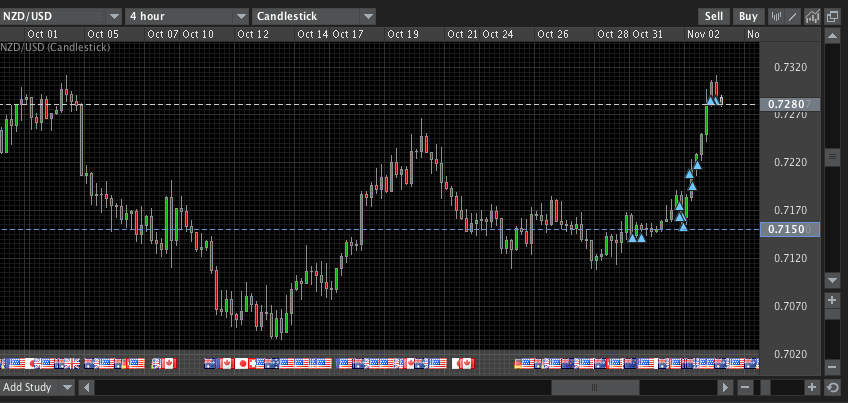
Looks like market manipulation to me!!! Any views?
Členom od Feb 22, 2011
4573 príspevkov
Oct 18, 2016 at 15:10
Členom od Feb 22, 2011
4573 príspevkov
It seems to me as funny indocatprs, nothing more.
Členom od Mar 01, 2013
54 príspevkov
Oct 19, 2016 at 13:37
Členom od Mar 01, 2013
54 príspevkov
oh that probably algorithm feeding time. if theres a red or green arrow the algorithms go into feeding frenzy
Členom od Mar 14, 2016
43 príspevkov
Nov 01, 2016 at 14:59
Členom od Mar 14, 2016
43 príspevkov
where exactly do you see the manipulation? 😄
Členom od May 05, 2014
1 príspevkov
Nov 02, 2016 at 07:43
Členom od May 05, 2014
1 príspevkov
Could you please tell me which indicators are using ? Thanks

forex_trader_169700
Členom od Dec 30, 2013
163 príspevkov
Nov 02, 2016 at 08:16
Členom od Dec 30, 2013
163 príspevkov
Hi Flabrune
I'm using my own concoction of Parabolic and Moving Averages.
1. Open up blank chart.
2. Place Parabolic on chart.
3. Right Click on Chart and go to Indicators List.
4. In Indicators List, highlight Parabolic and Edit.
5. Change Colour if required and then go to Width and go to 2.
6. Place 1 Day Smooth Moving Average On Chart.
7. Again Right Click on Chart and go to Indicators, highlight Moving Average and Edit.
8. Apply to First Indicator's Data.
9. Place 5 Day Smooth Moving Average on chart and any other MA's you may want.
10. Right Click on Chart, go to Template and Save Template. In File name save as: pma.tpl so you can open and apply it on any chart.
11. If you want to use the template again, right click on chart and go to Template and you will see it listed.
How to use:
Draw trend lines through the 5 day Smooth Moving Average and where it crosses the parabolic between the High parabolic and the low parabolic. Start from the monthly and work backwards. See charts examples. Please note I have not put all the trend lines.

forex_trader_169700
Členom od Dec 30, 2013
163 príspevkov
Nov 02, 2016 at 09:37
Členom od Dec 30, 2013
163 príspevkov
Please note: Draw horizontal lines where Moving Average Crosses Parabolic as these provide support and resistance.
Členom od Sep 20, 2014
342 príspevkov
Nov 02, 2016 at 09:56
Členom od Sep 20, 2014
342 príspevkov
The markets are openly manipulated.
Several large banks have now paid fines for anything from interest rate to gold fixes. DB is facing a $15 billion fine which will send them into insolvency.
Gold is the worst, probably manipulated at top government level.
There's no mystery here. Markets are continuously and openly manipulated at the highest level.
Členom od Feb 12, 2016
507 príspevkov
Nov 02, 2016 at 12:53
Členom od Feb 12, 2016
507 príspevkov
Hi Tony I just saw your charts especially the last ones. Just an advice from my side , you are using way too much indicators and trend lines, the pure candles and price action is not getting seen and it will start to confuse you sooner or later. You should use lesser trend lines. Hope you see and understand my point someday . trading is hard anyway don’t make it even harder. Cheers

forex_trader_169700
Členom od Dec 30, 2013
163 príspevkov
Nov 02, 2016 at 14:42
Členom od Dec 30, 2013
163 príspevkov
Hi Baldo
I agree, but I'm getting use to it now. I wish I could, my monitors are 24'', to be honest I need monitors the size of my lounge!!! I've got so many charts up, it's unbelievable, just so that I can double check everything. Thanks for the advice.
I agree, but I'm getting use to it now. I wish I could, my monitors are 24'', to be honest I need monitors the size of my lounge!!! I've got so many charts up, it's unbelievable, just so that I can double check everything. Thanks for the advice.
Členom od Sep 20, 2014
342 príspevkov
Nov 02, 2016 at 14:57
Členom od Sep 20, 2014
342 príspevkov
Un farking believable...
The mind boggles.
The mind boggles.
Členom od Sep 20, 2014
342 príspevkov
Nov 03, 2016 at 00:28
(upravené Nov 03, 2016 at 00:29)
Členom od Sep 20, 2014
342 príspevkov
Členom od Sep 20, 2014
342 príspevkov
Nov 03, 2016 at 00:31
Členom od Sep 20, 2014
342 príspevkov
Členom od Sep 20, 2014
342 príspevkov
Nov 03, 2016 at 01:12
(upravené Nov 03, 2016 at 01:35)
Členom od Sep 20, 2014
342 príspevkov
Členom od Jun 28, 2015
9 príspevkov
Nov 03, 2016 at 07:33
Členom od Jun 28, 2015
9 príspevkov
I am so confused by what Greggy is implying or concluding here. You are making up your own indicators that illustrate what? your self described as "inexperienced" & have only demo accounts show that have consistently and quickly met a disastrous fate. I'm not uber experienced, but...
Cut it while it's hot.

forex_trader_29148
Členom od Feb 11, 2011
1768 príspevkov

forex_trader_169700
Členom od Dec 30, 2013
163 príspevkov
Nov 03, 2016 at 07:46
Členom od Dec 30, 2013
163 príspevkov
What system or algorithm are you using?

forex_trader_169700
Členom od Dec 30, 2013
163 príspevkov
Nov 03, 2016 at 07:46
Členom od Dec 30, 2013
163 príspevkov
theHand posted:
Here's another one. Not a moments thought given to which way it was going to go.
What system or algorithm are you using?
Členom od Aug 21, 2016
1 príspevkov
Nov 03, 2016 at 07:46
Členom od Aug 21, 2016
1 príspevkov
Can you explain a bit more what you showing? is this a custom indicator?
Thanks
Thanks

forex_trader_169700
Členom od Dec 30, 2013
163 príspevkov
Nov 03, 2016 at 07:49
Členom od Dec 30, 2013
163 príspevkov
theHand posted:
Zip zero technical analyses. I have 10 lines of code that does this.
You guys can waste your time if you want to. Me I'd rather hit the beach.
How can we get our hands on this 10 lines of code?

*Komerčné použitie a spam nebudú tolerované a môžu viesť k zrušeniu účtu.
Tip: Uverejnením adresy URL obrázku /služby YouTube sa automaticky vloží do vášho príspevku!
Tip: Zadajte znak @, aby ste automaticky vyplnili meno používateľa, ktorý sa zúčastňuje tejto diskusie.


