


GOLD Analysis: Gold prices failed to rise again


Fundamental Analysis of GOLD
GOLD Key Takeaways
Russia-Ukraine conflict progress: The Ukrainian parliament supports Zelensky’s extension of his term, Musk continues to call for elections, and Zelensky plans to go to Washington on Friday to meet with Trump.
US economic data: US consumer confidence in February hit the largest single-month drop in more than three years, and pessimism about the future has returned. According to the Conference Board data, the consumer confidence index fell 7 points to 98.3 in February, and the expectations index fell 9.3 points to 72.9. This is the first time since June 2024 that the expectations index has fallen below the critical value of 80, which indicates an economic recession.
Technical Analysis of GOLD Daily and Hourly ChartsGOLD Daily Chart Insights
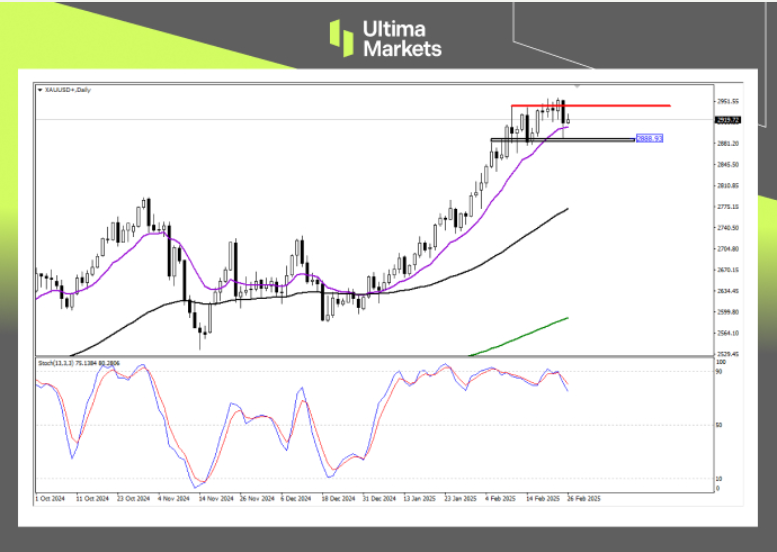
(GOLD Daily Price Chart, Source: Ultima Markets MT4)
Stochastic oscillator:The indicator is about to send a short signal in the overbought area, suggesting that the short-term bullish force has faded, and at the same time, it forms a top divergence pattern with the gold price, alerting the short-term adjustment and decline of gold.
Key support: Yesterday, the gold price fell rapidly, and was finally blocked by the purple 13-day moving average and the 2888.93 level. The market price is expected to continue to rise before it falls below this support level, otherwise the gold price will fall into a deep adjustment trend.
GOLD H1 Chart Analysis
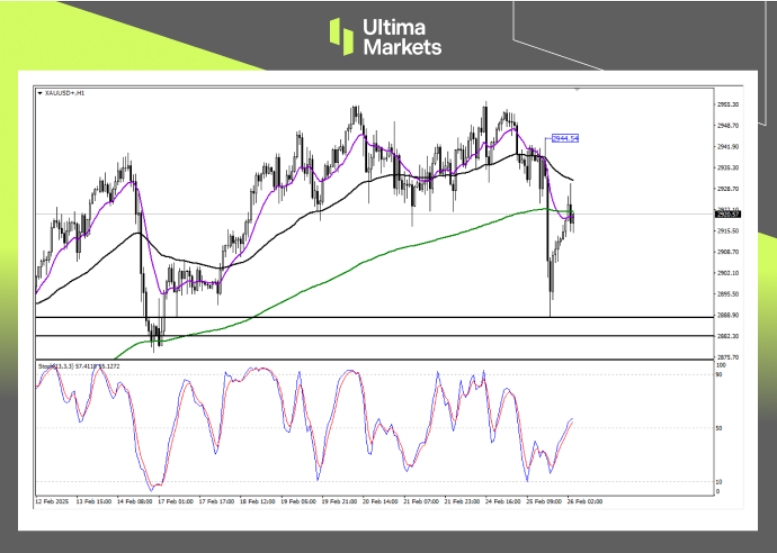
(GOLD H1 Price Chart, Source: Ultima Markets MT4)
Stochastic oscillator: The indicator sends a long signal again below the 50 median line, which makes it clear that the long and short positions are still in the game stage during the Asian session, and the gold price will fluctuate and rebound.
Key price: The gold price rebounded strongly during the Asian session, but the upper 2944.54 is the stage high, and the gold price is still in a downward trend before it breaks through this price.
Pivot Indicator Insights for GOLD
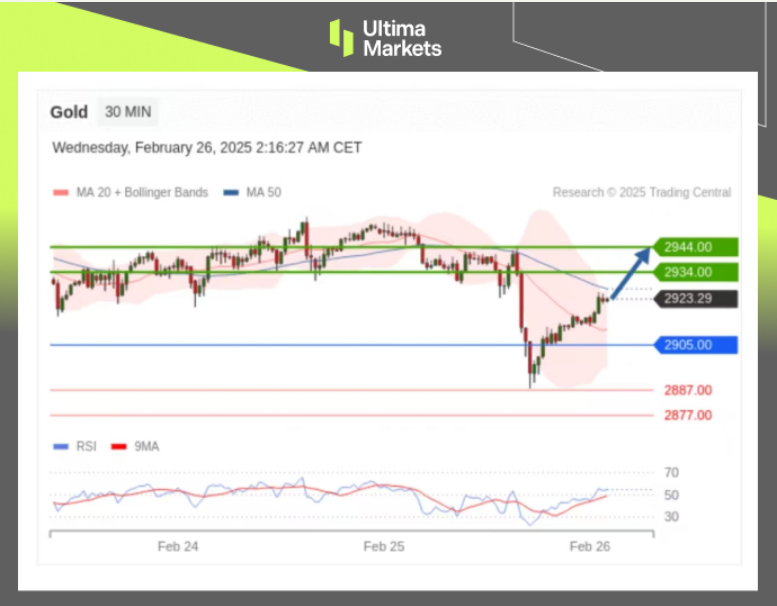
(GOLD M30 Price Chart, Source: Ultima Markets APP)
According to Pivot Indicator in Ultima Markets APP, the central price of the day is established at 2905,
Bullish Scenario: Bullish sentiment prevails above 2905, first target 2934, second target 2944;
Bearish Outlook: In a bearish scenario below 2905, first target 2887, second target 2877.
Learn more: https://bit.ly/4gWTyEA
How to Navigate the Forex Market with Ultima MarketsTo navigate the complex world of trading successfully, it’s imperative to stay informed and make data-driven decisions. Ultima Markets remains dedicated to providing you with valuable insights to empower your financial journey.
For personalized guidance tailored to your specific financial situation, please do not hesitate to contact Ultima Markets.
Join Ultima Markets today and access a comprehensive trading ecosystem equipped with the tools and knowledge needed to thrive in the financial markets.
Stay tuned for more updates and analyses from our team of experts at Ultima Markets.
—–
Legal Documents
Ultima Markets, a trading name of Ultima Markets Ltd, is authorized and regulated by the Financial Services Commission “FSC” of Mauritius as an Investment Dealer (Full-Service Dealer, excluding Underwriting) (license No. GB 23201593). The registered office address: 2nd Floor, The Catalyst, 40 Silicon Avenue, Ebene Cybercity, 72201, Mauritius.
Copyright © 2025 Ultima Markets Ltd. All rights reserved.
Disclaimer
Comments, news, research, analysis, price, and all information contained in the article only serve as general information for readers and do not suggest any advice. Ultima Markets has taken reasonable measures to provide up-to-date information, but cannot guarantee accuracy, and may modify without notice. Ultima Markets will not be responsible for any loss incurred due to the application of the information provided.


EBC Markets Briefing | Sterling eases before budget release; bullion tumbles

USD/JPY Extends Gains as Japanese Government Advocates for Dovish Policy

ATFX Economic Calendar- 2025.11.17~2025.11.21

ATFX Market Outlook 17th November 2025

The market lacks liquidity

The market lacks liquidity

S&P 500 Outlook: Rip Higher or Drop Lower?


