


Technical Analysis – Are gold bulls completely down?


Gold opened on Monday with mild gains near 3,983, a short distance above its almost two-week low of 3,886, which had emerged after a constructive meeting between President Donald Trump and China’s leader Xi Jinping led to a pause – but not an end – in import tariffs and trade tensions last week.
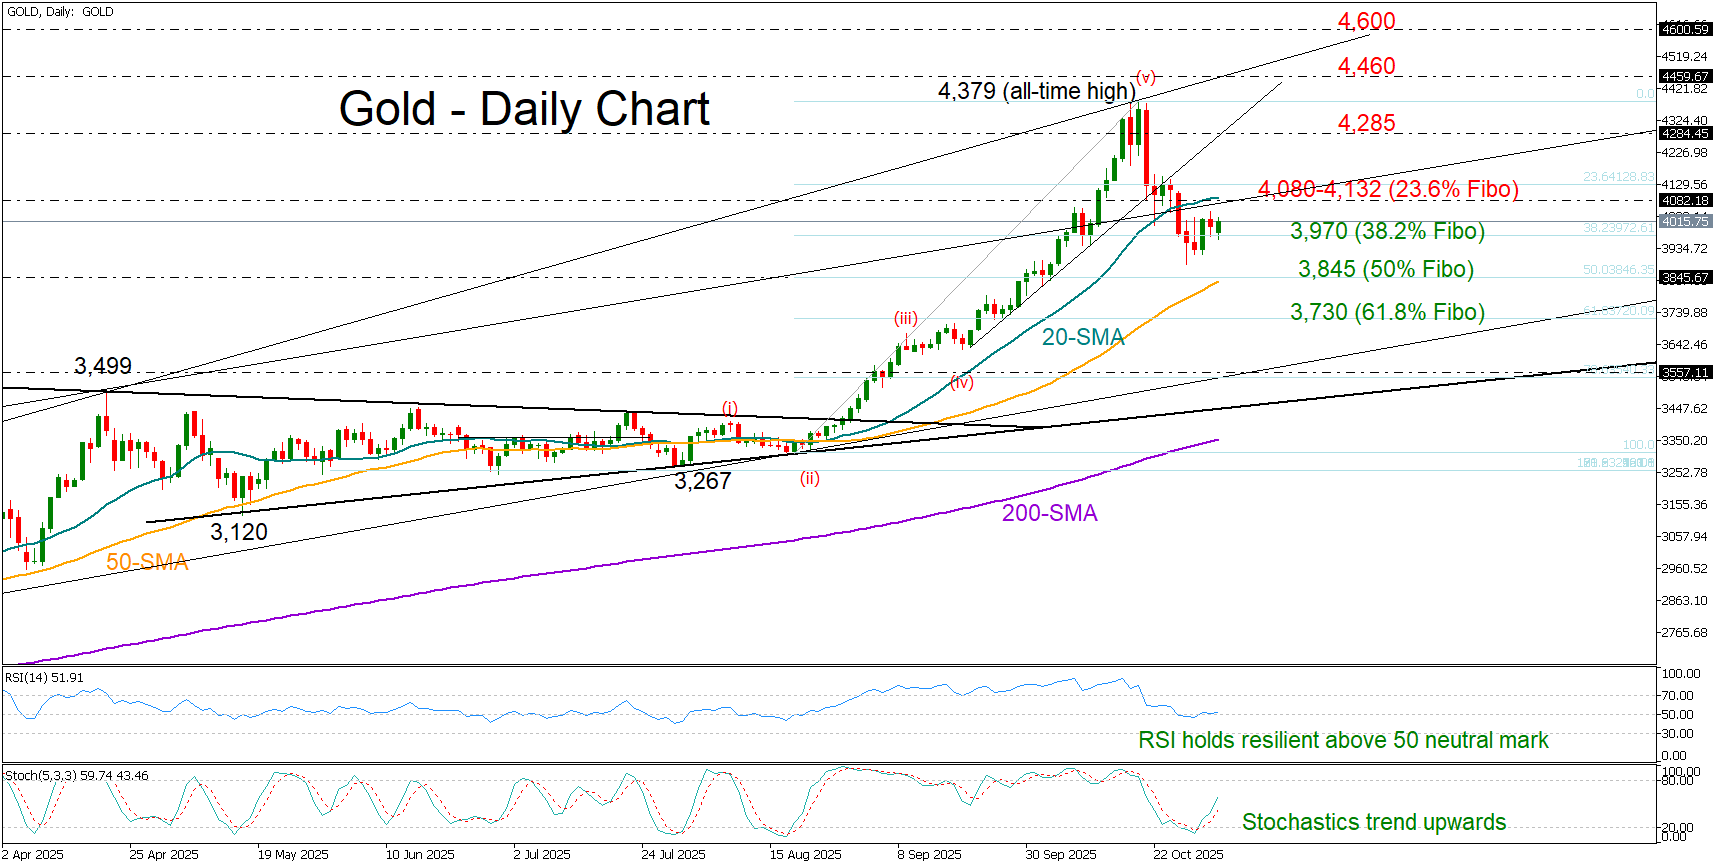
Despite the recent modest upturn, the precious metal failed to close above Wednesday’s intraday high of 4,025 and remained trapped below its 20-day simple moving average (SMA) at 4,082. Yet, the bulls could make another attempt, as the RSI is holding resiliently above its neutral 50 mark and the stochastic oscillator is trending upward.
Should the bulls clear the 4,080-4,132 territory – which also encapsulates the 23.6% Fibonacci retracement level of the August–October upleg – they could next aim for the 4,285 zone. If the latter gives way, the door could open for a retest of the all-time high at 4,379 or even the resistance line at 4,460.
Conversely, if the price falls back below the 38.2% Fibonacci level at 3,970, the 50-day SMA could help limit selling pressure near the 50% Fibonacci mark at 3,845. The 61.8% Fibonacci level at 3,730 could also keep the bears busy before attention shifts to the long-term support trendline drawn from December 2024 at 3,560.
All in all, gold bulls are not completely down after the steep fall from the all-time high of 4,379. They could make another attempt to regain control, though only a sustained move above the 4,132 barrier would signal meaningful progress.
.jpg "Technical Analysis – Are gold bulls completely down?")

The euro holds on by a thread

Risk sentiment falters, dollar fails to materially capitalize

Crypto is on the verge of a bear market

Crypto is on the verge of a bear market

EBC Markets Briefing | Turkey's lira hopeless; South Korean stocks roar ahead

Central Banks Drive FX Moves: RBA Holds, BoJ Hints at Hikes | 4th November 2025

ATFX Market Outlook 4th November 2025


