


USDCAD Analysis: With Trump’s official inauguration, the Canadian dollar takes the first hit.


Fundamental Analysis of USDJPYUSDCAD Key Takeaways
- Trump’s Inauguration: Donald Trump was officially sworn in as the 47th President of the United States in Washington, D.C. In his inaugural address, he stated that the inflation crisis is caused by excessive spending and rising energy prices. He announced plans to “drill, baby, drill ” for more oil, which could put downward pressure on oil prices.
- Tariff Policy: Following the inauguration, Trump indicated that he is considering imposing a 25% tariff on Canada and Mexico starting February 1st. Affected by oil prices and the potential tariffs, the Canadian dollar may experience a short-term depreciation trend.
Technical Analysis of USDCAD Daily and Hourly Charts
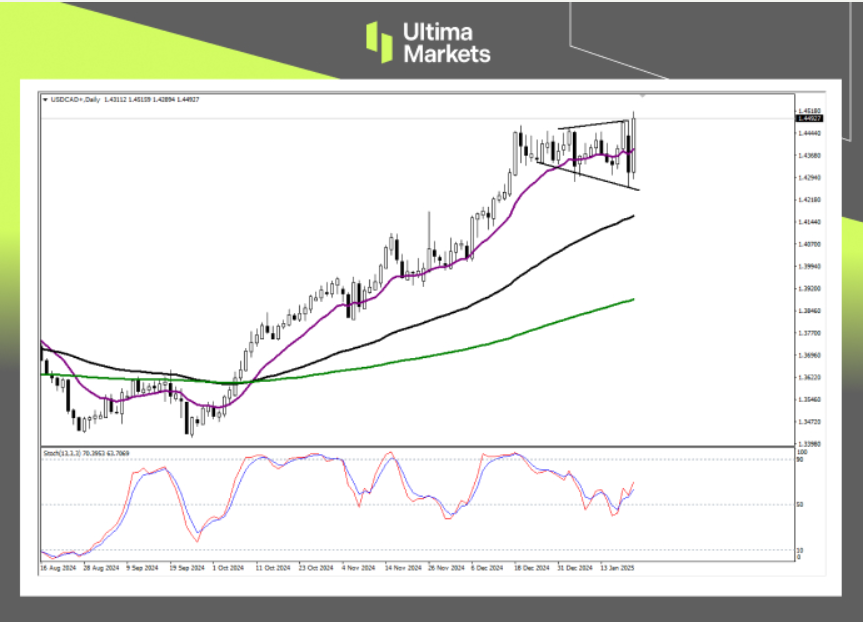
(USDCAD Daily Price Chart, Source: Ultima Markets MT4)
- Stochastic oscillator: The indicator has once again issued a bullish signal near the 50 midline, with the fast line seemingly poised to accelerate upward. This suggests that after nearly a month of continuous consolidation, the exchange rate may continue to rise.
- Expanding Triangle: Since the peak on December 19th, USD/CAD has been consolidating for nearly a month. The current candlestick pattern appears to form an expanding triangle. According to Elliott Wave Theory, an expanding triangle is typically associated with extreme market sentiment and increased trading volume, reflecting market uncertainty and investor indecision.
- Theoretical Target: In Elliott Wave Theory, once an expanding triangle is completed, prices often break out strongly (thrust) to end the consolidation phase. The breakout direction is usually consistent with the main trend. The target after the breakout can be estimated by measuring the widest part of the triangle.
USDCAD 1-hour Chart Analysis 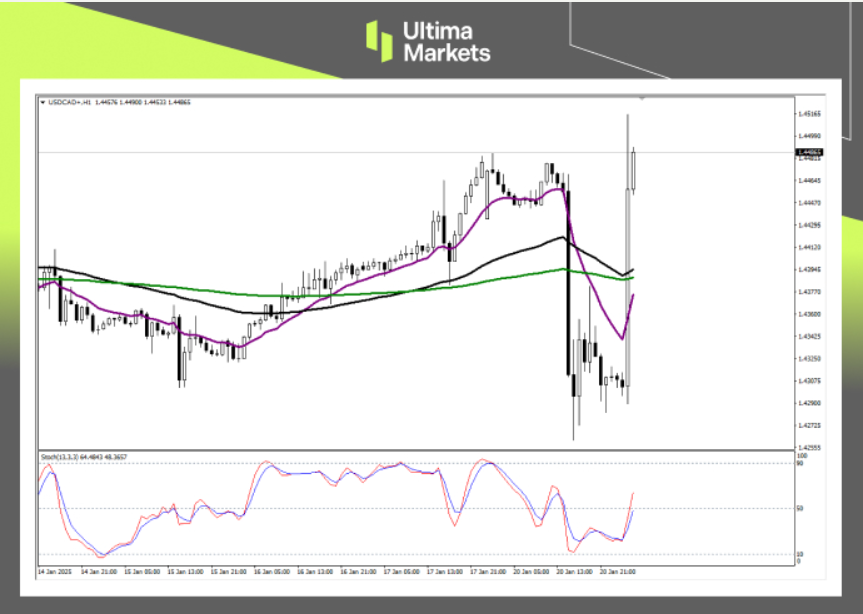
(USDCAD H1 Price Chart, Source: Ultima Markets MT4)
- Stochastic oscillator: Yesterday, the exchange rate experienced increased volatility, but the indicator did not quickly approach the oversold area. Today, during the Asian session, it once again issued a bullish signal, breaking above the 50 midline. This suggests that the market is currently in a tug-of-war between bulls and bears, and it is not advisable to judge the trend direction based solely on simple indicator signals.
- Potential Resistance: Based on the daily trend logic, the current strong upward movement may be the final impulse wave. Therefore, after confirming that the exchange rate is in a five-wave structure, be cautious of further erratic movements.
Pivot Indicator Insights for USDJPY
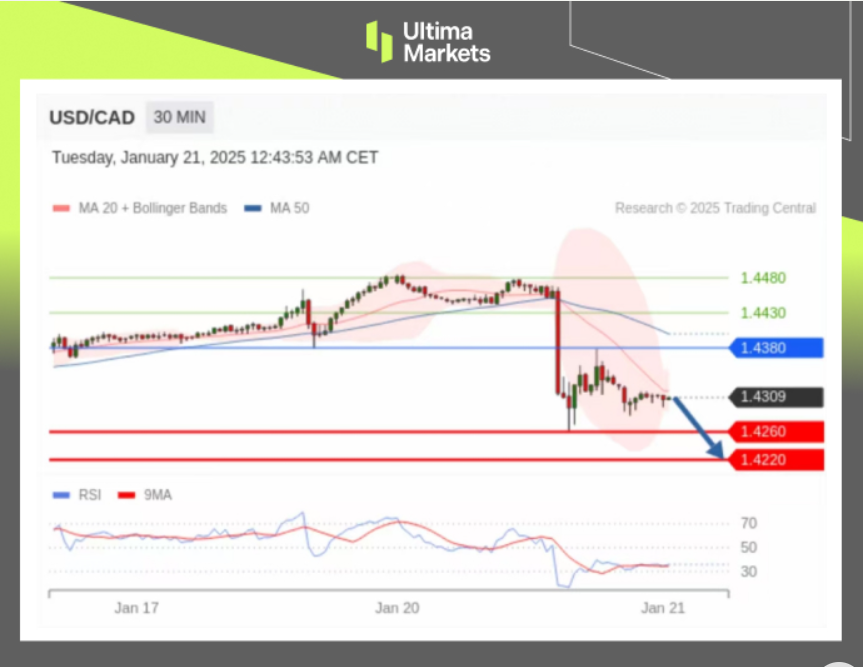
(USDCAD M30 Price Chart, Source: Ultima Markets APP)
- According to Pivot Indicator in Ultima Markets APP, the central price of the day is established at 1.4380,
- Bullish Scenario: Bullish sentiment prevails above 1.4380, first target 1.4430, second target 1.4480;
- Bearish Outlook: In a bearish scenario below 1.4380, first target 1.4260, second target 1.4220.
How to Navigate the Forex Market with Ultima Markets To navigate the complex world of trading successfully, it’s imperative to stay informed and make data-driven decisions. Ultima Markets remains dedicated to providing you with valuable insights to empower your financial journey.
For personalized guidance tailored to your specific financial situation, please do not hesitate to contact Ultima Markets.
Join Ultima Markets today and access a comprehensive trading ecosystem equipped with the tools and knowledge needed to thrive in the financial markets.
Stay tuned for more updates and analyses from our team of experts at Ultima Markets.
—–
Legal Documents
Ultima Markets, a trading name of Ultima Markets Ltd, is authorized and regulated by the Financial Services Commission “FSC” of Mauritius as an Investment Dealer (Full-Service Dealer, excluding Underwriting) (license No. GB 23201593). The registered office address: 2nd Floor, The Catalyst, 40 Silicon Avenue, Ebene Cybercity, 72201, Mauritius.
Copyright © 2025 Ultima Markets Ltd. All rights reserved.
Disclaimer
Comments, news, research, analysis, price, and all information contained in the article only serve as general information for readers and do not suggest any advice. Ultima Markets has taken reasonable measures to provide up-to-date information, but cannot guarantee accuracy, and may modify without notice. Ultima Markets will not be responsible for any loss incurred due to the application of the information provided.


The yen is about to become a favourite

Fed Cut Bets Lift Majors as Commodity FX Finds Support | 28th November 2025

Dollar: internal weakness plus improvement among competitors

USD/JPY Extends Decline as Yen Recovers on Intervention Fears

Gold and Silver in Focus: 5 Key Metals Headlines | 27th November 2025

Yen Strengthens on BoJ Bets, Global Markets Eye Fed Policy | 26th November 2025

DNA Markets - Daily Fundamental Analysis Report 26 November


