VIX Analysis: Panic continues to spread

Fundamental Analysis of VIXVIX Key Takeaways
- US stocks fell: US stocks hit their lowest level since Obama took office in 2009 during the global financial crisis. Since Trump was elected US President on January 20, the S&P 500 has fallen 6.4%, the tech-heavy Nasdaq Composite Index has fallen more than 10%, and the Dow Jones Industrial Average has fallen 3.6%.
- Increased risk of recession: When Trump was asked last week whether the United States would have a recession this year, Trump said he did not rule out the possibility of a recession. And just last Friday, the new US Treasury Secretary Bessant told CNBC directly that there were some signs of weakness in the US economy. He warned that the US economy will slow down and go through a “detoxification period” to get rid of growth dependence on government spending.
Technical Analysis of VIX Daily and Hourly ChartsVIX Daily Chart Insights
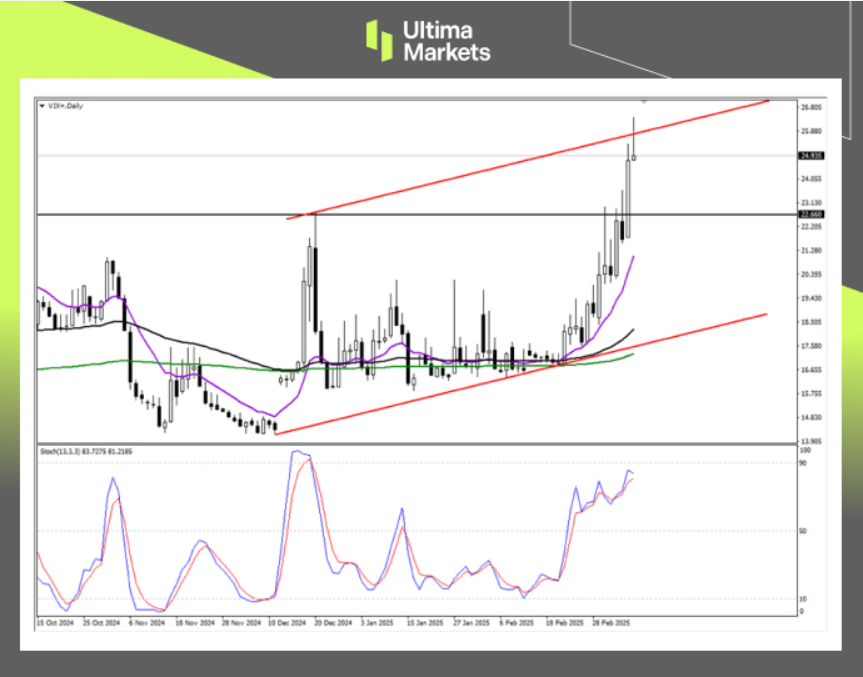
(VIX Daily Price Chart, Source: Ultima Markets MT4)
- Stochastic oscillator : After exceeding the 50 median line, the indicator slowed down and fluctuated for a period of time. Last Thursday, the bullish signal was once again clear, making it clear that the current VIX Volatility Index will continue to rise, and market panic began to spread.
- Resistance area: The horizontal price of around 22.7 has long been the key resistance of the VIX Volatility Index. Yesterday, the volatility index officially broke through this price and is currently blocked by the upward channel line. There is a probability of a short-term decline, but the market price does not fall below the 22.7 support price, and the bullish idea is still the main one.
VIX H1 Chart Analysis
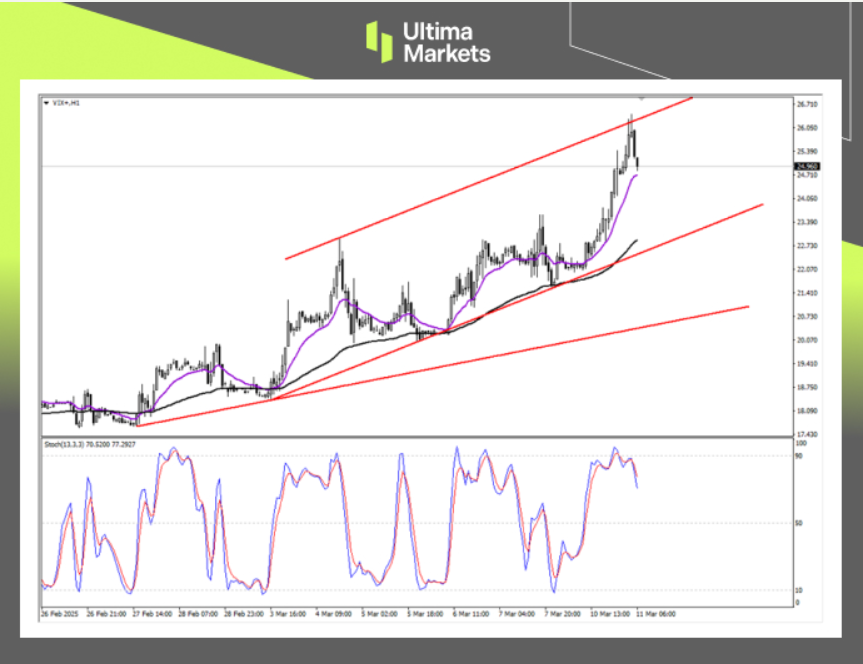
(VIX H1 Price Chart, Source: Ultima Markets MT4)
- Stochastic oscillator:During the Asian session, the indicator sends a short signal in the overbought area, and at the same time forms a top divergence with the market price, and the price faces a short-term downward adjustment.
- Resistance area: The market price is accelerating upward, and is currently blocked by the upward channel line. The purple 13-period moving average below is the short-term support price. If it falls below, today may be dominated by a volatile trend.
Pivot Indicator Insights for VIX
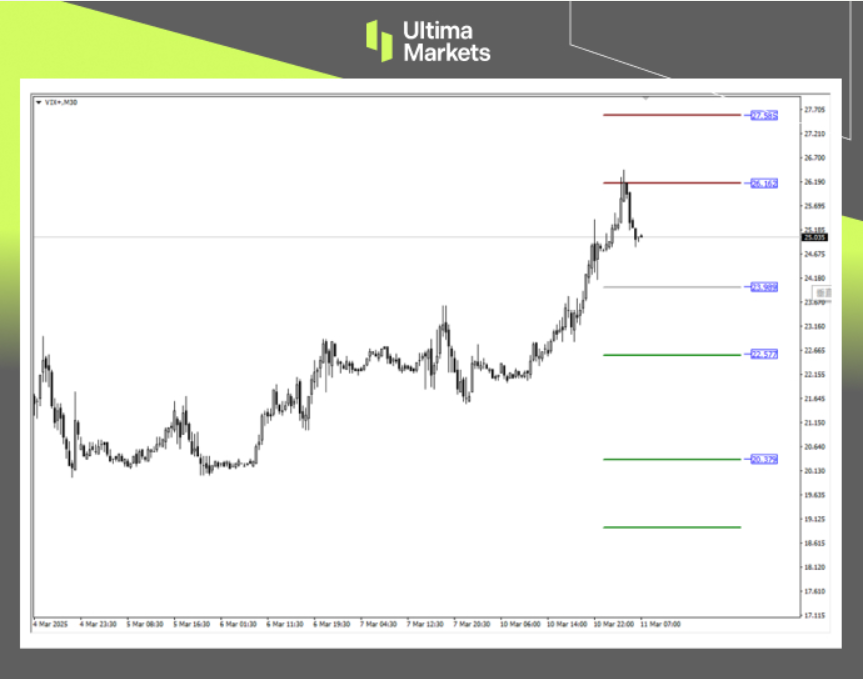
(VIX M30 Price Chart, Source: Ultima Markets MT4)
- According to Pivot Indicator in Ultima Markets MT4, the central price of the day is established at 147.30,
- Bullish Scenario: Bullish sentiment prevails above 147.30, first target 148.40, second target 148.80;
- Bearish Outlook: In a bearish scenario below 147.30, first target 147.00, second target 146.70.
How to Navigate the Forex Market with Ultima MarketsTo navigate the complex world of trading successfully, it’s imperative to stay informed and make data-driven decisions. Ultima Markets remains dedicated to providing you with valuable insights to empower your financial journey.
For personalized guidance tailored to your specific financial situation, please do not hesitate to contact Ultima Markets.
Join Ultima Markets today and access a comprehensive trading ecosystem equipped with the tools and knowledge needed to thrive in the financial markets.
Stay tuned for more updates and analyses from our team of experts at Ultima Markets.
Learn more: https://bit.ly/4gWTyEA
—–
Legal Documents
Ultima Markets, a trading name of Ultima Markets Ltd, is authorized and regulated by the Financial Services Commission “FSC” of Mauritius as an Investment Dealer (Full-Service Dealer, excluding Underwriting) (license No. GB 23201593). The registered office address: 2nd Floor, The Catalyst, 40 Silicon Avenue, Ebene Cybercity, 72201, Mauritius.
Copyright © 2025 Ultima Markets Ltd. All rights reserved.
Disclaimer
Comments, news, research, analysis, price, and all information contained in the article only serve as general information for readers and do not suggest any advice. Ultima Markets has taken reasonable measures to provide up-to-date information, but cannot guarantee accuracy, and may modify without notice. Ultima Markets will not be responsible for any loss incurred due to the application of the information provided.


The Great Gold Reallocation: Central Banks Rethink Reserve Security 💥

The dollar has staked its fate on the NFP

Weekly Analysis: Markets Find Support in Employment Data as Gold Rebounds and Oil Stays Elevated

Futures Move First: What the Market’s First Hour Really Tells Traders

Snowflake Tests AI Rally Strength After Earnings Surge

Bitcoin Holds Above $81,000 as NFP Data Sets the Next Direction

Dovish Fed bets pummel dollar, boost gold ahead of NFP