The strategy developers write that it works equally successfully both on intraday and longer timeframes.
Rules of the trading strategy
The strategy uses Fibonacci retracement levels and RSI indicator. The main idea is to:
enter into the current trend movement on retracement;
enter into a new trend movement after reversal.
Algorithm of the strategy application. First, we look for a major wave in the chart. The wave should be more than 40 points for 5-minute charts and more than 150 points for 4-hour charts. From the mathematical point of view, the wavelength is the difference between its high and low. These points should be local highs and lows. As soon as the wave has been detected, we build Fibonacci retracement levels:
0.000 – bottom level of the wave;
0.250 – bottom level of confirmation;
0.382 – bottom boundary of the corrective channel;
0.618 – upper boundary of the corrective channel;
0.750 – upper level of confirmation;
1.000 – upper level of the wave.
Fibonacci retracement levels are symmetrical in our case, that's why it makes no difference for us in what direction to build them and where 0 and 100% would be.
As soon as a new wave of the required length emerges, the old one becomes invalid. We build Fibonacci retracement levels again and trade by the new wave signals.
We buy if:
RSI (14) is more than 50 in a day chart. We use this indicator to filter out buying or selling signals and reduce the number of loss-making trades. The strategy developers tested different variants of filter indicators CCI, MA and RSI with various periods. And they selected RSI(14) after testing.
Any candle closed within the corrective channel of 0.382-0.618, and the price moved back in the direction of the upper confirmation level of 0.750.
The whole candle closed above the upper confirmation level of 0.750.
A strict stop is 50 points. This strategy doesn’t envisage stopping movement to the breakeven level and further trailing. The strategy developers selected this stop size also after testing.
Take profit – receipt of the opposite signal or actuation of a stop signal.
We sell if:
RSI (14) is less than 50 in a day chart.
Any candle closed within the corrective channel of 0.382-0.618, and the price moved back to the bottom confirmation level of 0.250.
The whole candle closed under the bottom confirmation level of 0.250.
A strict stop is 50 points. This strategy doesn’t envisage stopping movement to the breakeven level and further trailing.
Take profit – receipt of the opposite signal or actuation of a stop signal.
We will use the ruler instrument in the course of our experiment with this strategy in the trading and analytical ATAS platform. It is a convenient instrument for measuring wave characteristics. With just two screen touches, we have complete information – ticks, volume, delta, time and a number of bars in the selected fragment. You can activate the ruler in the upper menu or by pressing the F9 key.
A detailed analysis of the trading situation on the 5-minute and 4-hour charts of the E-micro EUR/USD M6EM9 futures can be found in the article on our website.
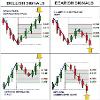
The trading strategy developers distinguish impulsive and corrective waves. The yellow arrow points at the candle, after closing which we open a trade.
Buying signals in the left column:
we buy when the demand wave overpasses the high of the previous buying wave;
we buy after the completion of a downward retracement in the area of 0.5 Fibo.
Selling signals in the right column:
we sell after completion of the upward retracement in the area of 0.5 Fibo
we sell when the selling wave overpasses the low of the previous buying wave.
Let’s have a look how the strategy works in real charts.
A detailed analysis of the trading situation on the 5-minute and 4-hour charts of the E-micro EUR/USD M6EM9 futures can be found in the article "How ATAS indicators improve popular Forex strategies" on our website.