


Cracks in the gold rally? Not just yet


Gold extended its short-term decline below its 20- and 50-day simple moving averages (SMAs) after Federal Reserve Chair Jerome Powell questioned the case for a July rate cut during his semi-annual testimony before Congress last week. Additionally, recent U.S. data backed this narrative, revealing signs of rising inflationary pressures and a pullback in jobless claims.
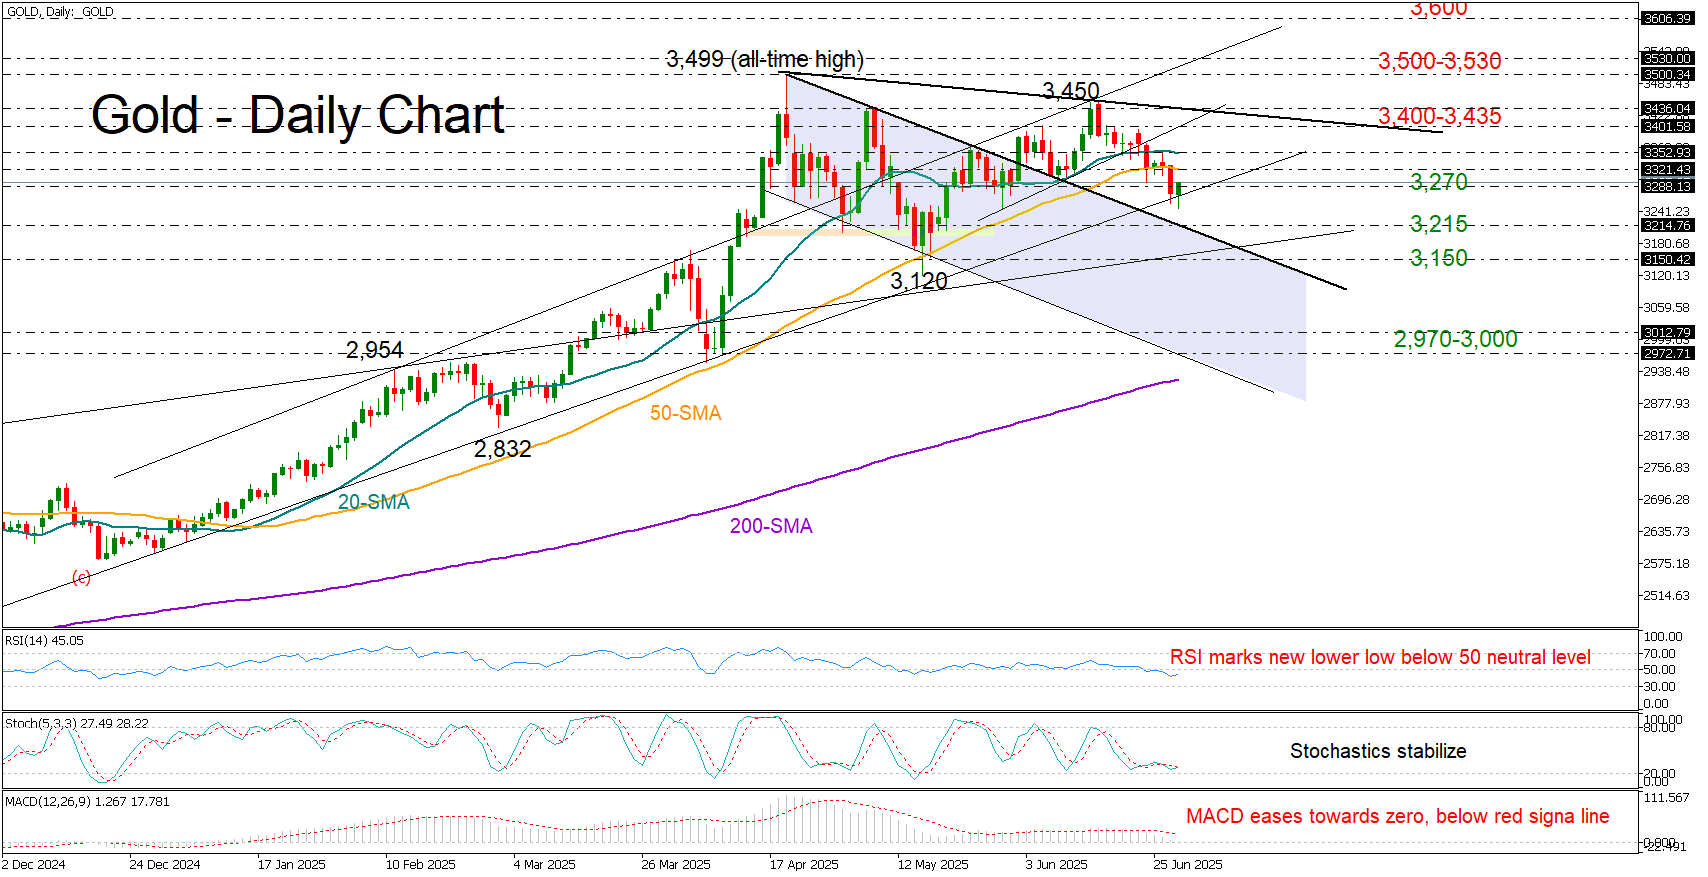
Nevertheless, the support trendline drawn from December 2024 continues to act as a safety net around the 3,270 zone. This comes as the July 9 tariffs deadline approaches, with sticking points between the U.S. and its trade partners persisting – suggesting that agreements may take longer to finalize, or that quick solutions could leave key issues unresolved.
Technically, the risk remains tilted to the downside in the short-term picture given the weakening momentum in the RSI and MACD indicators. The RSI is printing new lower lows below its neutral 50 mark. If bearish pressure intensifies in the coming sessions, the price could retest the upper band of the former bearish channel at 3,215, followed by the rising support line from October 2024 at 3,150. A drop below that level could accelerate losses toward the psychological 3,000 mark, or even lower to 2,970.
On the upside, if strong catalysts push the precious metal back above its 20- and 50-day SMAs (currently at 3,320–3,350), the next challenge may pop up within the 3,400-3,435 area. A decisive close above that border could pave the way to 3,500, or test resistance near 3,530, before potentially targeting the 3,600 level.
In summary, gold has not completely lost its potential for a bullish reversal, despite the weakening technical indicators. Downside pressures may still encourage a "buy the dip" strategy, as long as the price holds within its sideways structure above 3,150.
.jpg "Cracks in the gold rally? Not just yet")

EBC Markets Briefing | AI race is spinning out of control

Stocks plunge on AI valuation worries, gold and yen bounce back

ETHUSD Falls Below Key Support as Bearish Momentum Strengthens

Forex goes to safe havens

Forex goes to safe havens

GBP/USD takes a hit on UK budget jitters

If the 4-year cycles are still alive, BTC faces a pullback to $70K


