


EURUSD Analysis: Global funds flee US dollar assets


Fundamental Analysis of HK TECHHK TECH Key Takeaways
- Risk aversion soars: US inflation cools beyond expectations, core CPI in March hits the lowest year-on-year growth rate in four years, and CPI falls month-on-month for the first time in nearly five years. However, the threat of escalating tariff wars overwhelms the benefits of slowing inflation, and investors’ concerns regain the upper hand. US assets such as US stocks and US dollars are sold off, and safe-haven assets such as Swiss francs, yen and gold rise across the board.
- Rising risk of US default: The record gold price and the lowest US dollar index in two years not only illustrate the current uncertainty and volatility, but also reflect that global investors are continuing to lose confidence in the US exceptionalism. Currently, US sovereign risk is soaring, and US CDS spreads are widening sharply.
Technical Analysis of HK TECH Daily and Hourly Charts
HK TECH Daily Chart Insights
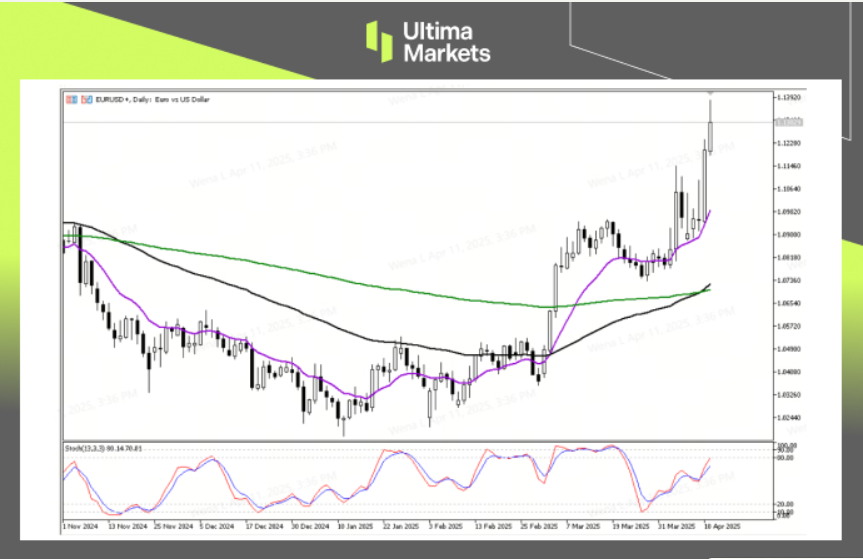
(HK TECH Daily Price Chart, Source: Ultima Markets MT5)
- Stochastic oscillator: The indicator once again sends a bullish signal, suggesting that short-term bulls have the upper hand, and bullish sentiment is high, which is worth paying attention to trend trading opportunities.
- Extremely bullish: Although the euro opened strongly against the US dollar, the current extreme bullish sentiment has the upper hand. From the perspective of investment and trading, the holding time should not be too long, and be wary of the impact of fundamentals.
HK TECH 1-hour Chart Analysis
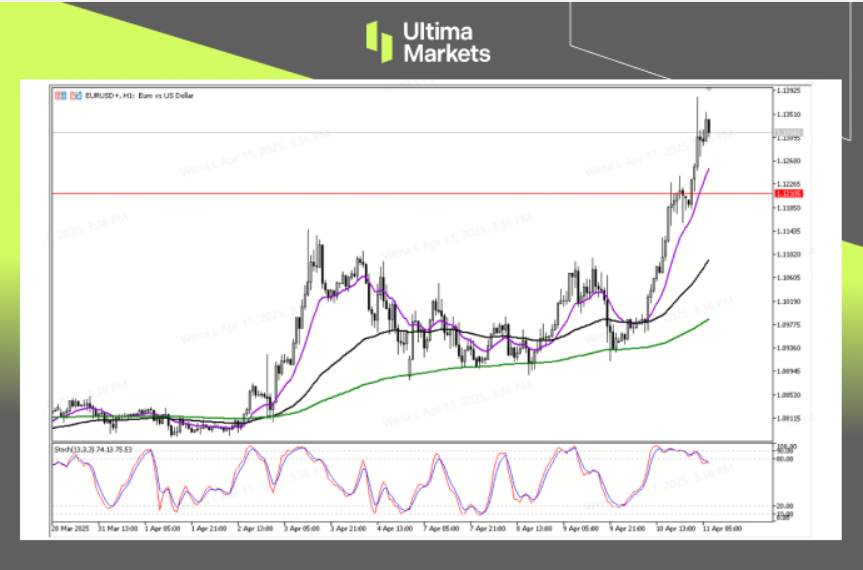
(HK TECH H1 Price Chart, Source: Ultima Markets MT5)
- Stochastic oscillator: The indicator and the exchange rate form a clear divergence trend during the Asian session, and there is a probability of short-term adjustment in the exchange rate.
- Support price: The purple 13-period moving average is the support price of the strong trend. If the exchange rate effectively falls below it, the upward trend will clearly enter the adjustment stage.
EUR/USD PIVIOT INDICATOR
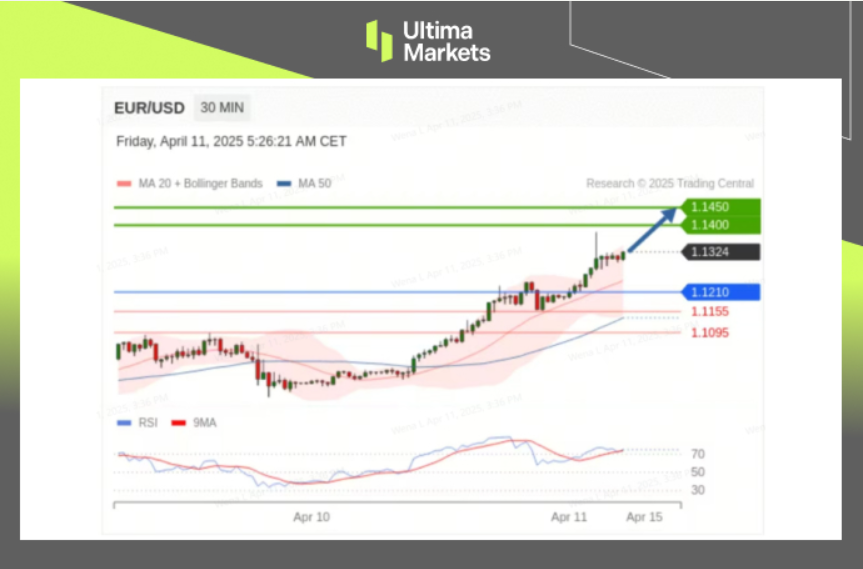
(EUR/USD M30, source: Ultima Markets APP)
- According to the trading central pivot line indicator of Ultima Markets APP, the central price of the day is 1.1210,
- Above 1.1210, bullish, first target 1.1400, second target 1.1450
- Bearish below 1.1210, first target 1.1155, second target 1.1095
How to Navigate the Forex Market with Ultima Markets To navigate the complex world of trading successfully, it’s imperative to stay informed and make data-driven decisions. Ultima Markets remains dedicated to providing you with valuable insights to empower your financial journey.
For personalized guidance tailored to your specific financial situation, please do not hesitate to contact Ultima Markets.
Join Ultima Markets today and access a comprehensive trading ecosystem equipped with the tools and knowledge needed to thrive in the financial markets.
Stay tuned for more updates and analyses from our team of experts at Ultima Markets.
Learn more: https://bit.ly/4gWTyEA
—–
Legal Documents
Ultima Markets, a trading name of Ultima Markets Ltd, is authorized and regulated by the Financial Services Commission “FSC” of Mauritius as an Investment Dealer (Full-Service Dealer, excluding Underwriting) (license No. GB 23201593). The registered office address: 2nd Floor, The Catalyst, 40 Silicon Avenue, Ebene Cybercity, 72201, Mauritius.
Copyright © 2025 Ultima Markets Ltd. All rights reserved.
Disclaimer
Comments, news, research, analysis, price, and all information contained in the article only serve as general information for readers and do not suggest any advice. Ultima Markets has taken reasonable measures to provide up-to-date information, but cannot guarantee accuracy, and may modify without notice. Ultima Markets will not be responsible for any loss incurred due to the application of the information provided.


EUR/USD Holds Steady as US Government Shutdown Ends

The dollar roller coaster ride

Understanding Stop Loss Hunting During November Volatility – Smart Risk-Management Insights

ATFX Market Outlook 11th November 2025

The dollar plays on bets

The dollar risks losing support from tariff revenues

The dollar risks losing support from tariff revenues


