


Gold Breaks Record Highs: What Traders Should Watch at the End of 2025


Gold (XAU/USD) has continued to surge in recent sessions, breaking historical highs around 4,400 USD. The rally is mainly driven by expectations for U.S. monetary policy, geopolitical tensions, and increased safe-haven demand. At the same time, year-end fund flows and physical buying have further supported the upward momentum.
Technical Overview
On the daily chart, gold has just broken a key resistance level around 4,400 USD—the previous high from October—and closed above it. The Higher High – Higher Low structure is very clear. The breakout candle features a large body closing near the top, indicating genuine buying pressure rather than a false breakout.
Key technical signals supporting this move include:
MACD: The MACD line is above the Signal line, and the Histogram is positive and expanding. The MACD slope has increased after a consolidation phase. Momentum is rising, and no negative divergence has appeared. 
Bollinger Bands: The price closed outside the Upper Band and expanded strongly, with MA20 sloping upwards → a strong trend-following signal, not a signal to trade against the trend. 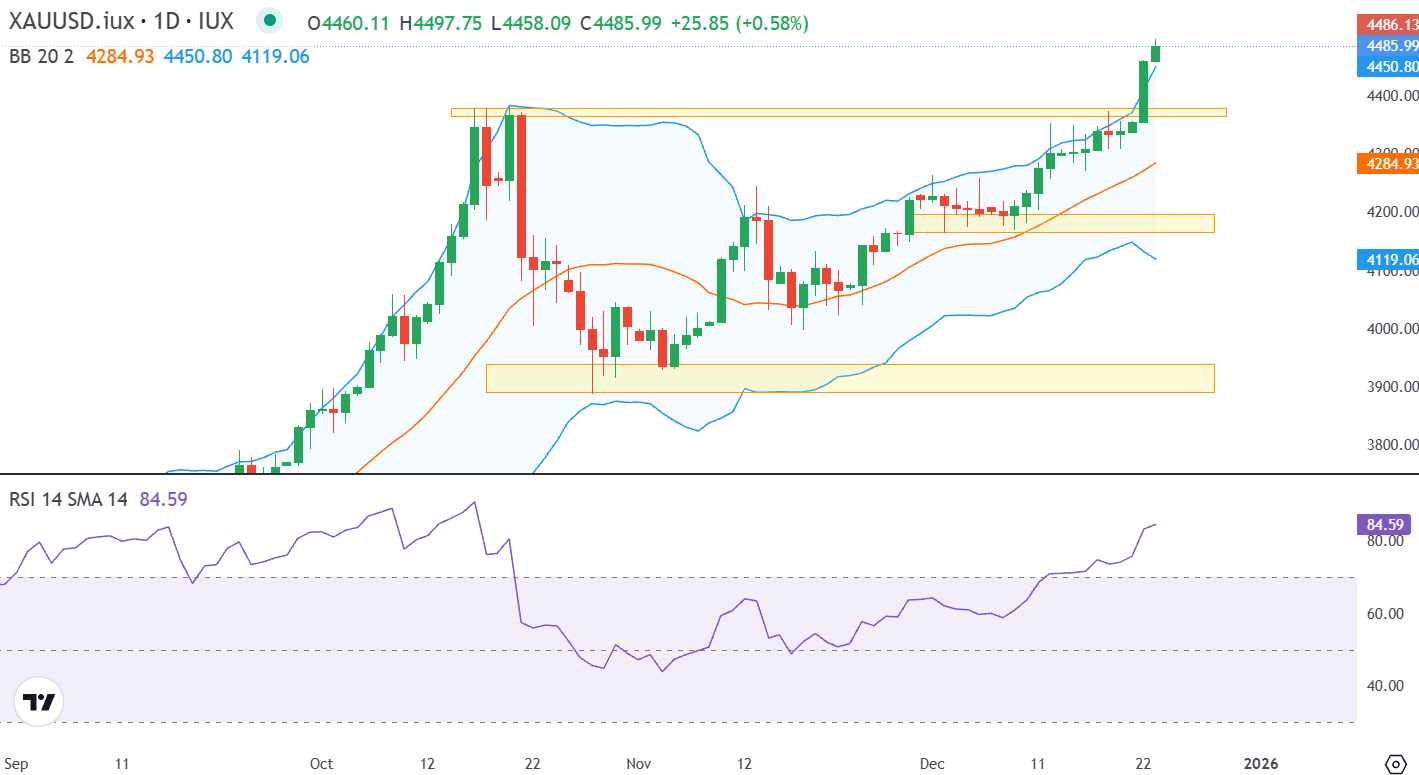
RSI: At 84.6, RSI is in overbought territory, signaling strong buying pressure. In strong trends, RSI can stay elevated for several days, and currently, no divergence is observed. 
Fibonacci Extension: The price is approaching the 1.272 Fibonacci extension at around 4,515 USD, a reasonable short-term target for the current wave. This level can serve as a partial profit-taking zone before potential market fluctuations.ATR: At 57.9 and declining, ATR indicates that while the price is rising, volatility is not extreme and the money flow remains controlled.
Key Support Levels to Watch if a Pullback Occurs:
- Recently broken resistance: ~4,400 USD (now acting as support)
- Medium-term demand: ~4,200 USD
- Strong demand: ~3,900 USD
End-of-Year Fundamental Factors
The end of the year is typically a strong period for gold. In countries like India and China, physical demand rises due to festivals, weddings, and Lunar New Year. Meanwhile, investment funds often rebalance portfolios, adding to buying pressure.
Conversely, market liquidity tends to decline as the U.S. and Europe enter holiday periods, especially from Christmas to early January. This can trigger short-term spikes and higher volatility but does not necessarily alter the long-term trend.
Economic Events to MonitorA key upcoming event is the U.S. Preliminary GDP (q/q) report on December 23.
- If the figure comes in below expectations → the USD may weaken, supporting further gains in gold.
- If the figure is stronger than expected → it could put downward pressure on gold prices.
Key Takeaways for Traders
- Main Trend: Strong upward trend, with a clear Higher High – Higher Low structure.
- Short Term: Technical indicators suggest a possible mild pullback toward support zones, but the trend remains intact.
- Long Term: The upward trend is likely to continue; be aware of end-of-year spikes and low liquidity volatility. Traders should closely monitor important economic events, set appropriate stop-loss levels, and consider taking profits at short-term technical zones.


Safe-Haven Rush Lifts Gold and Silver as Geopolitical Tensions Rise | 22nd December 2025

Central banks did not scare the dollar

Markets Reassess Fed Cut Bets as Softer US CPI Triggers Mixed Moves | 19th December 2025

Gold Bulls Pause as Intraday Correction Looms

Gold Rallies as China Data Weighs on Antipodean Currencies | 15th December 2025

Metals Strength as Fed Cut Boosts Sentiment; USD Softens, Commodities Mixed | 11th December 2025

Gold's 4200 Level as Bulls and Bears Battle for Control


