


SP500 Analysis: Cautious on Danger Approaching


Fundamental Analysis of SP500
SP500 Key Takeaways
- Trump calls for buying stocks: Before the US stock market midday on Thursday, Trump said that if the trade agreement combined with tax cuts can achieve results, “you’d better go out and buy stocks now.” After the speech, the three major US stock indexes rose further. The S&P 500 rose nearly 1.6% in the midday trading, the Nasdaq rose 2% in the midday trading, and the Dow rose nearly 660 points in the midday trading, an increase of about 1.6%.
- UK-US trade negotiations: Local time on the 8th, the United Kingdom and the United States have reached an agreement on the terms of the tariff trade agreement. However, many details of the agreement have yet to be finalized, and the 10% so-called “reciprocal tariff” previously imposed by the United States has not been canceled.
Technical Analysis of SP500
SP500 Daily Chart Insights
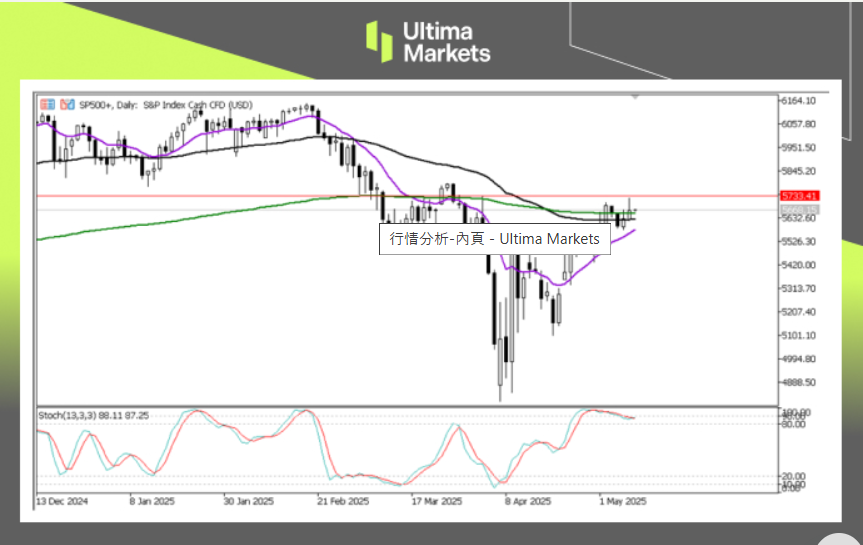
- Stochastic oscillator: The indicator is entangled and falling in the overbought area, suggesting that short-term bullish sentiment is slowing down, and we need to be extremely vigilant and not overly optimistic.
- Key resistance: The S&P is finally approaching the resistance price since Trump announced the so-called reciprocal tariff on April 2 in a volatile rise. It is also near the green 200-day moving average. There is a probability that the US stock market will continue to fluctuate or even end the rebound trend in this area.
SP500 2-hour Chart Analysis
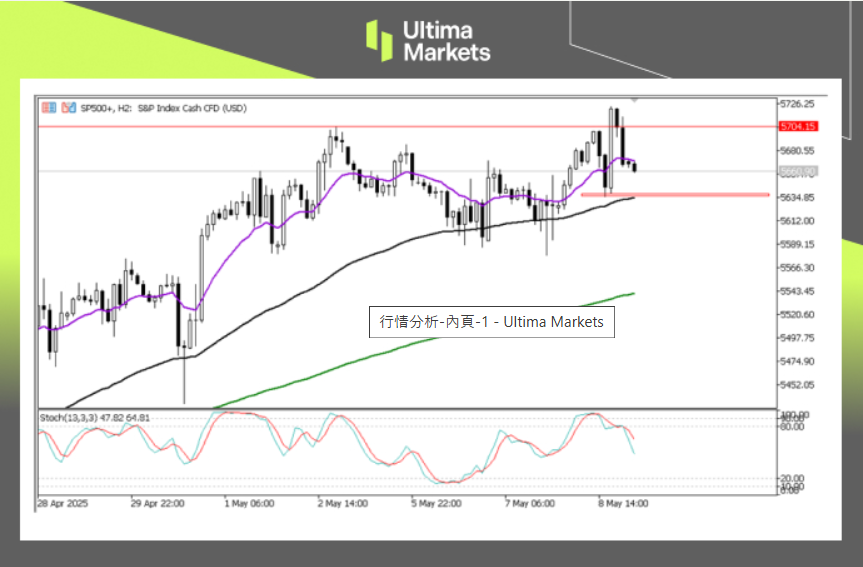
- Stochastic oscillator: The indicator sends a short signal in the overbought area, and both the fast and slow line indicators are out of the overbought area, suggesting that the index is about to usher in a downward trend.
- Naked K structure: The S&P 500 index quickly broke through the 5704 area and then gradually fell. The index has now fallen below the 13-period moving average. From the naked K, there is a probability of a false breakthrough. Once the index falls below the black 65-period moving average, which is also the lowest price of the big rise K line, the S&P will most likely end the bullish trend.
SP500 Pivot Indicator
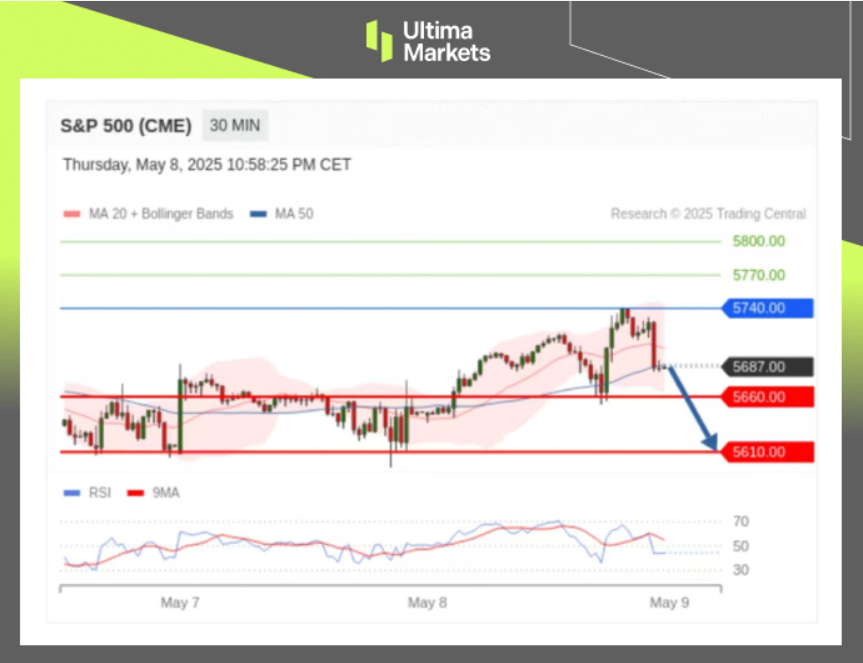
- According to the trading central in Ultima Markets APP, the central price of the day is established at 5740,
- Bullish Scenario: Bullish sentiment prevails above 5740, first target 5770, second target 5800;
- Bearish Outlook: In a bearish scenario below 5740, first target 5660, second target 5610.
How to Navigate the Forex Market with Ultima Markets
To navigate the complex world of trading successfully, it’s imperative to stay informed and make data-driven decisions. Ultima Markets remains dedicated to providing you with valuable insights to empower your financial journey. For personalized guidance tailored to your specific financial situation, please do not hesitate to contact Ultima Markets.
Join Ultima Markets today and access a comprehensive trading ecosystem equipped with the tools and knowledge needed to thrive in the financial markets. Stay tuned for more updates and analyses from our team of experts at Ultima Markets.
—–
Legal Documents
Ultima Markets, a trading name of Ultima Markets Ltd, is authorized and regulated by the Financial Services Commission “FSC” of Mauritius as an Investment Dealer (Full-Service Dealer, excluding Underwriting) (license No. GB 23201593). The registered office address: 2nd Floor, The Catalyst, 40 Silicon Avenue, Ebene Cybercity, 72201, Mauritius.
Copyright © 2025 Ultima Markets Ltd. All rights reserved.
Disclaimer
Comments, news, research, analysis, price, and all information contained in the article only serve as general information for readers and do not suggest any advice. Ultima Markets has taken reasonable measures to provide up-to-date information, but cannot guarantee accuracy, and may modify without notice. Ultima Markets will not be responsible for any loss incurred due to the application of the information provided.


FX Markets Shift on Fed Easing Bets as Oil and Aussie Dollar Find Support | 23rd December 2025

Yen rallies on fresh intervention warnings; dollar falls

GBP/USD: UK GDP Growth Matches Forecasts

The yen was saved by interventions

EURUSD Analysis: Bulls Regain Control with Sights Set on 1.1900

The crypto market is preparing us for a deeper global sell-off

EBC Markets Briefing | Pound strengths; bullion price unstoppable


