


Advertisement
Bitcoin (BTC) analysis thread

Uczestnik z Mar 18, 2019
97 postów
Aug 25, 2020 at 11:00
momo3HC posted:
Hi all.
Well, Bitcoin dropped 3% from the last week and around 7% from it`s high at the beginning of this one. Is it so bad? I don`t think so! Why? I`ll show you below so don`t freak out but zoom out.
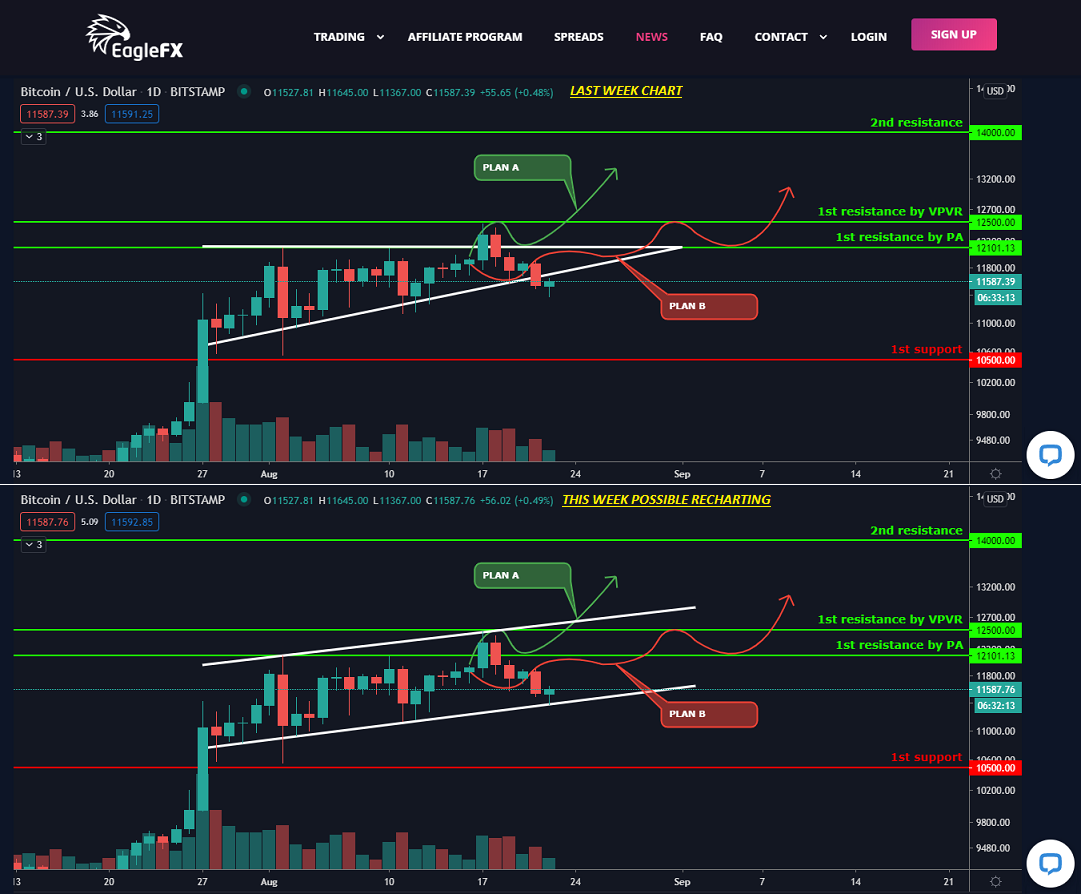
Last week daily chart VS this week possible re-charting (chart1)
Last week I was talking about an ascending triangle and 2 (or even 3) possible scenarios. At the beginning of this week all seems like scenario A is in play until the decline that came from nowhere. My personal opinion is that both the peak to $12500 and the drop to $11400 are just a fake moves if we`re looking at this ascending triangle chart. That`s why i`ve tried to ignore it and search for another pattern and almost immediately I saw the ascending channel (trend). A perfect one. Which pattern from this 2 you`ll use is your decision but at this moment i`m 70:30 to the ascending channel (trend).
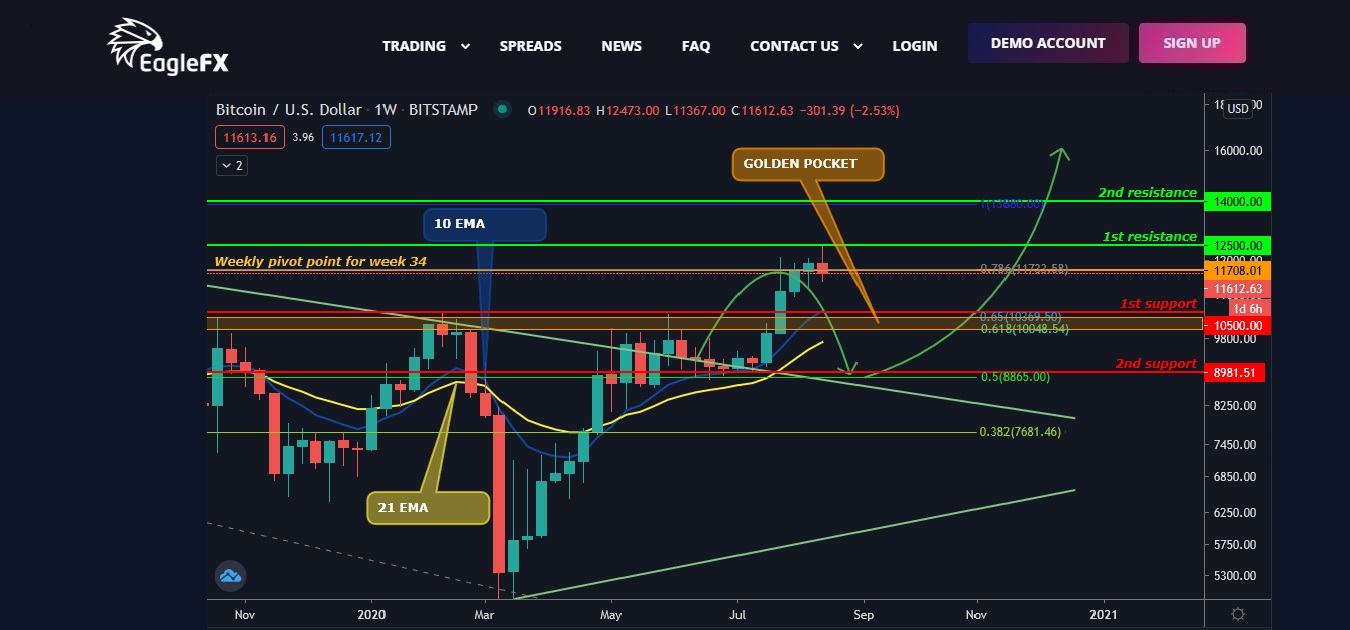
Weekly chart (chart 2)
Here are 2 things to say. The 1st one is that this chart was initially made at 28.06.2020. Look at the green arrows which are pointing the possible price move. Even I was surprised how accurate are they till now. The most important thing here is the newly added fibo retracement from the last summer 14K top to the corona drop to 3.8K this year. What can we see? A beautiful fibo golden pocket between 10K and 10.5K. This 10.5K sounds familiar right? So what`s the conclusion here? That`s even if we fall far below this ascending triangle or if we fall below this ascending channel, then we have a REALLY STRONG support at 10.5K and even a bit below this (around 10K).
Actual PA situation:
Support and resistance:
Support:
1st support - $10500 – last MAJOR resistance.
2nd support - $9000
Resistance:
1st resistance - $12100-12500 – almost the last bigger resistance before the clear skies, accordingly to VPVR. You saw where we stopped this week – exactly at $12500.
2nd resistance - $14000 – the last resistance before the 20K test I can say (the last top + VPVR). Somewhere between 1st and 2nd resistance is $10K, which can act as a support too cuz of the psychological level.
10 EMA – the price is still above it even without a touch of it.
21 EMA - the price is still above it even without a touch of it.
Correlation between 10 and 21 EMA – Despite the Corona drop every time when the 10 EMA is above the 21 EMA and the price is above both we can predict a very good bull period.
Parabolic SAR – Another bullish week and there`s 17 weeks bullish signaling (despite this week`s red candle for now).
Weekly pivot point is $11708,01.
That`s all for now and like i`ve said it before – these corrections are healthier than you think.
See ya next time.
excellent stuff bro, appreciate your positivity in your analysis. good day sir

Uczestnik z Oct 20, 2018
283 postów
Aug 30, 2020 at 17:45

Hi all.
Well, another not so good week for Bitcoin for now but let`s see the bigger picture (in chart 2).
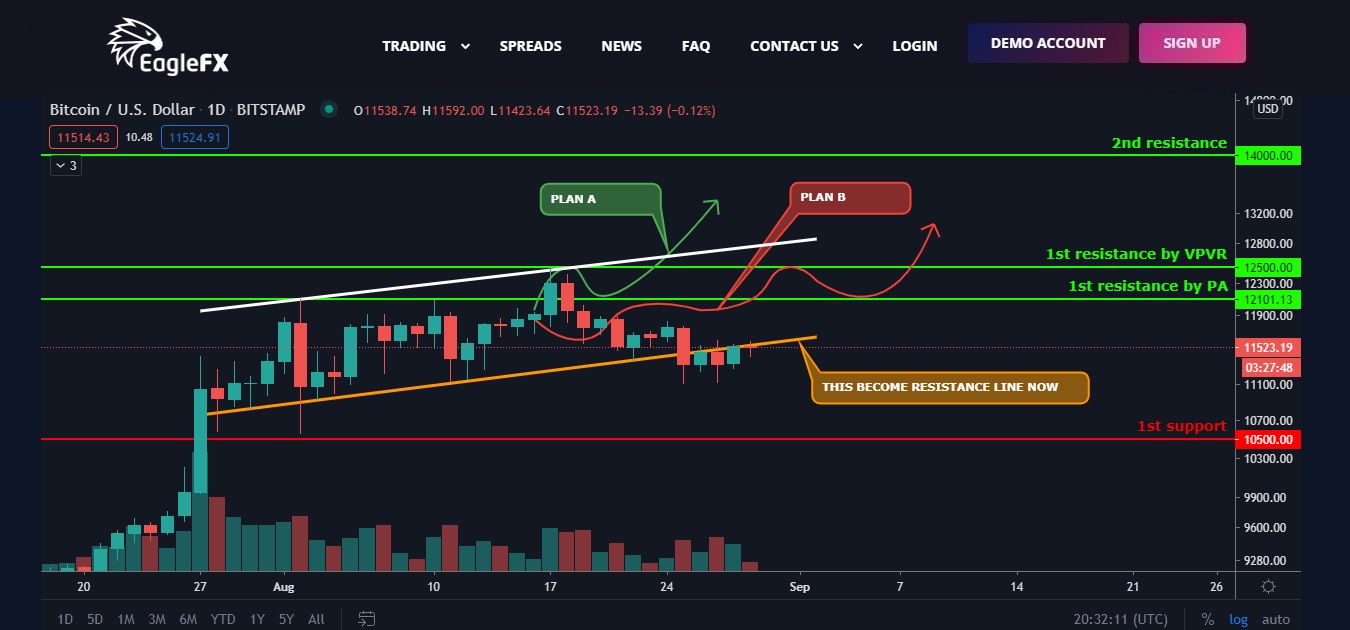
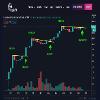
Ascending channel/trend broken (chart1)
Last week I was talking about an ascending channel/trend but at Wednesday it was broken down and now seems like it`s down line is acting like a resistance for the price. Let`s see how it will continue forward.
3 months chart (chart 2)
Now that`s may be the more important chart. Like you`ll see from the chart, every time when we close a 3 month candle above the descending trend line from the last ATH, the run for the next ATH is starting. Well we`re 32 days away from the close of the actual candle so we can only cross fingers to close it above. Don`t know about you but i`ll keep an eye on this chart for sure.
Actual PA situation:
Support and resistance:
Support:
1st support - $10500 – last MAJOR resistance.
2nd support - $9000 – also very important due to 3 month chart.
Resistance:
1st resistance - $12100-12500 – almost the last bigger resistance before the clear skies, accordingly to VPVR. You saw where we stopped this week – exactly at $12500.
2nd resistance - $14000 – the last resistance before the 20K test I can say (the last top + VPVR). Somewhere between 1st and 2nd resistance is $10K, which can act as a support too cuz of the psychological level.
10 EMA – the price is still above it even without a touch of it.
21 EMA - the price is still above it even without a touch of it.
Correlation between 10 and 21 EMA – Despite the Corona drop every time when the 10 EMA is above the 21 EMA and the price is above both we can predict a very good bull period.
Parabolic SAR – Another bullish week and there`s 18 weeks bullish signaling (despite this week`s red candle for now).
Weekly pivot point is $11828,22.
That`s all for now.
See ya next time.
Załączniki:
momchil_slavov@
Uczestnik z Oct 20, 2018
283 postów
Dec 12, 2021 at 10:23
Hey let`s refresh this thread. Any new visions?
momchil_slavov@
Uczestnik z Jul 20, 2020
385 postów
Mar 25, 2022 at 08:20
BTC has broken out to the upside for the time being. So positive!
Uczestnik z Mar 03, 2019
57 postów
Mar 27, 2022 at 20:25
I think that April is going to be a good month for bitcoin.
Uczestnik z Dec 09, 2013
138 postów
Mar 28, 2022 at 07:48
BTC seems to be very bullish again. The price made a bullish breakout at a significant horizontal level. The level may work as a flipped level of support. I am going to wait for the price to produce a bullish reversal candle around 45.300 to go long in BTC.
Uczestnik z Aug 10, 2021
172 postów
Mar 29, 2022 at 01:23
Very good analysis, I will continue to follow.
Uczestnik z Jul 20, 2020
385 postów
Mar 31, 2022 at 18:38
Small dip today but great to see how far its pushing up!
Uczestnik z Oct 20, 2018
283 postów
Mar 31, 2022 at 20:35
Hi all.
Long time no see but there’s plenty of reasons for this. First of all there’s no major change in my TA view because I’m looking only in long term BTC perspectives. Secondly I’m really busy. But… these days I’m setting some new hardware, getting it ready for work and while I was looking at the newly added funtionality at TradingView I’ve found something really interesting which I can`t miss to share with you.
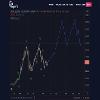
Just look at the chart below. It`s a 1D BTC chart with a perfect Elliott Wave (EW) price action. If you don’t know what Elliott Wave is you can see it here -> https://www.liberatedstocktrader.com/elliott-wave-theory-principle-examples-stock-market/. In short - Bitcoin is not in a bear market, neither we saw it`s top for this cycle yet.
The future projection (the blue line) is purely indicative. It’s based on the previous EW cycle which is good starting point for the next one and may be the next ATH.
That’s it for now. Think good about it. Soon I’ll try to look more deeper into charts to see what we can find more there to see more clearly the BTC presumable future moves.
Long time no see but there’s plenty of reasons for this. First of all there’s no major change in my TA view because I’m looking only in long term BTC perspectives. Secondly I’m really busy. But… these days I’m setting some new hardware, getting it ready for work and while I was looking at the newly added funtionality at TradingView I’ve found something really interesting which I can`t miss to share with you.
Just look at the chart below. It`s a 1D BTC chart with a perfect Elliott Wave (EW) price action. If you don’t know what Elliott Wave is you can see it here -> https://www.liberatedstocktrader.com/elliott-wave-theory-principle-examples-stock-market/. In short - Bitcoin is not in a bear market, neither we saw it`s top for this cycle yet.
The future projection (the blue line) is purely indicative. It’s based on the previous EW cycle which is good starting point for the next one and may be the next ATH.
That’s it for now. Think good about it. Soon I’ll try to look more deeper into charts to see what we can find more there to see more clearly the BTC presumable future moves.
Załączniki:
momchil_slavov@

Uczestnik z Apr 03, 2021
437 postów
Apr 01, 2022 at 00:29
BTC price today $45,672.73, drops .3.13%, the next possible support maybe $44k, in this month expected the price still move on range $40k and $50 price level, looking for low price to hit the market
Uczestnik z Jul 20, 2020
385 postów
Apr 10, 2022 at 14:25
FXOday posted:
BTC price today $45,672.73, drops .3.13%, the next possible support maybe $44k, in this month expected the price still move on range $40k and $50 price level, looking for low price to hit the market
Still in that massive range. Its got to break before im going to enter in a trade i think
Uczestnik z Dec 09, 2013
138 postów
Apr 13, 2022 at 08:25
BTC is approching 38K. This is the level, where the price had a strong bounce earlier. The level may hold the price and push it towards the North. Meanwhile, the bear is going to dominate in Bitcoin.
Uczestnik z Jul 20, 2020
385 postów
Apr 16, 2022 at 14:43
sharabela posted:
BTC is approching 38K. This is the level, where the price had a strong bounce earlier. The level may hold the price and push it towards the North. Meanwhile, the bear is going to dominate in Bitcoin.
It's still in that tight range on the higher timeframe. Atm its at 40K is but not broken any structure really cant wait for it to shows its hand properly

Uczestnik z Apr 09, 2019
516 postów
Apr 21, 2022 at 08:25
Might push on from here but no real strength in the impulse so looks stuck in a range at the moment.
If you can't spot the liquidity then you are the liquidity.
Uczestnik z Dec 09, 2013
138 postów
Apr 21, 2022 at 17:28
Bitcoin seems to have found its support at the up trending trendline's support. The daily chart shows that the price has been heading towards the North. I assume it may find its next resistance at the last swing high. It means there is enough space for the price to move towards the upside.
Uczestnik z Jul 20, 2020
385 postów
Apr 23, 2022 at 09:42
sharabela posted:
Bitcoin seems to have found its support at the up trending trendline's support. The daily chart shows that the price has been heading towards the North. I assume it may find its next resistance at the last swing high. It means there is enough space for the price to move towards the upside.
I think it is definitely still bullish there seems to be a lack of liquidity or momentum at the moment. Just ranging up and down atm


