


Advertisement
EUR/USD
Uczestnik z Dec 11, 2017
229 postów
May 07, 2018 at 07:03
Eur/Usd is sideway trading after broke below 1.20 support, and found new support zone around 1.9000/1.9010. The pair is still under a lot of pressure, it might continue further on the downside after the consolidation.

Uczestnik z Sep 10, 2017
1 postów
May 07, 2018 at 07:53
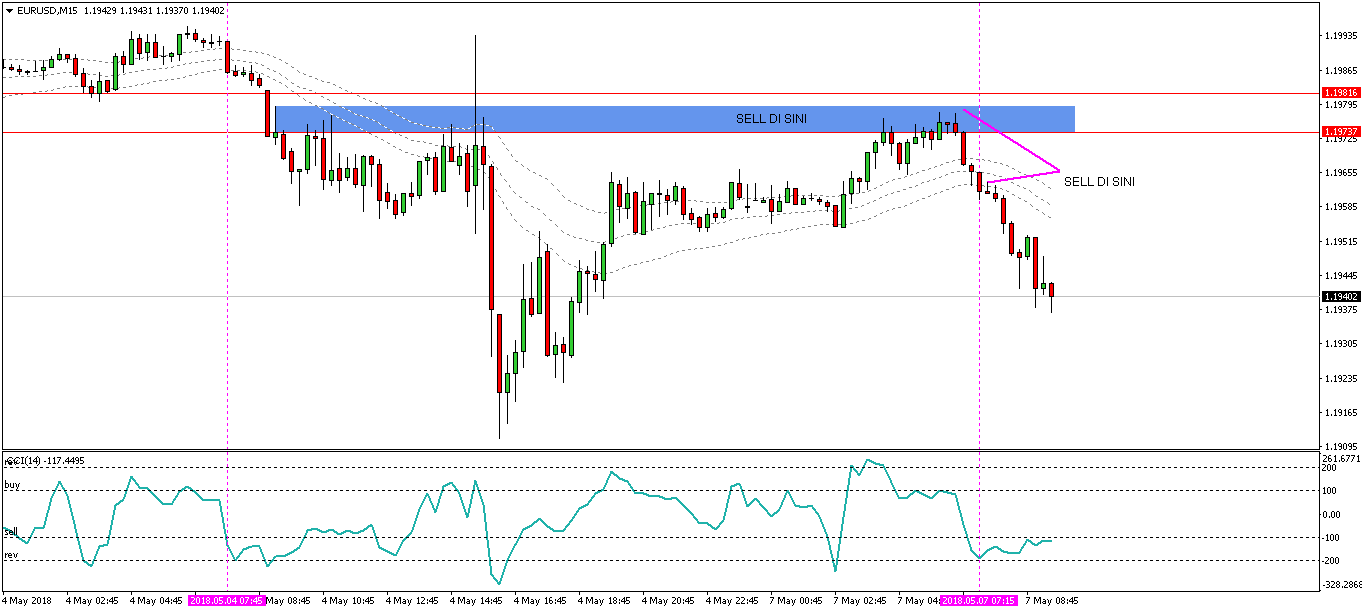
this my continue fall or juts pullback?
Załączniki:
learn,patience,earn

Uczestnik z Apr 08, 2014
1140 postów
May 07, 2018 at 08:38
On the last Friday’s session, the EURUSD initially fell with a wide range but found enough buying pressure near 2018 low to trim some of its losses and managed to close in the middle of the daily range, although closed within Thursday’s range, which suggests being clearly neutral, neither side is showing control.
The currency pair trading below the 10, the 50 and the 200-day moving averages that should provide dynamic resistance.
The key levels to watch: a daily resistance at 1.2287, a swing low at 1.2200 (resistance), a key level at 1.2165 (resistance), the 200-day moving average at 1.2050 (resistance), a daily resistance at 1.2041, the 10-day moving average at 1.2022 (resistance), and 2018 low at 1.1915 (support).
"I trade to make money not to be right."

May 08, 2018 at 06:39
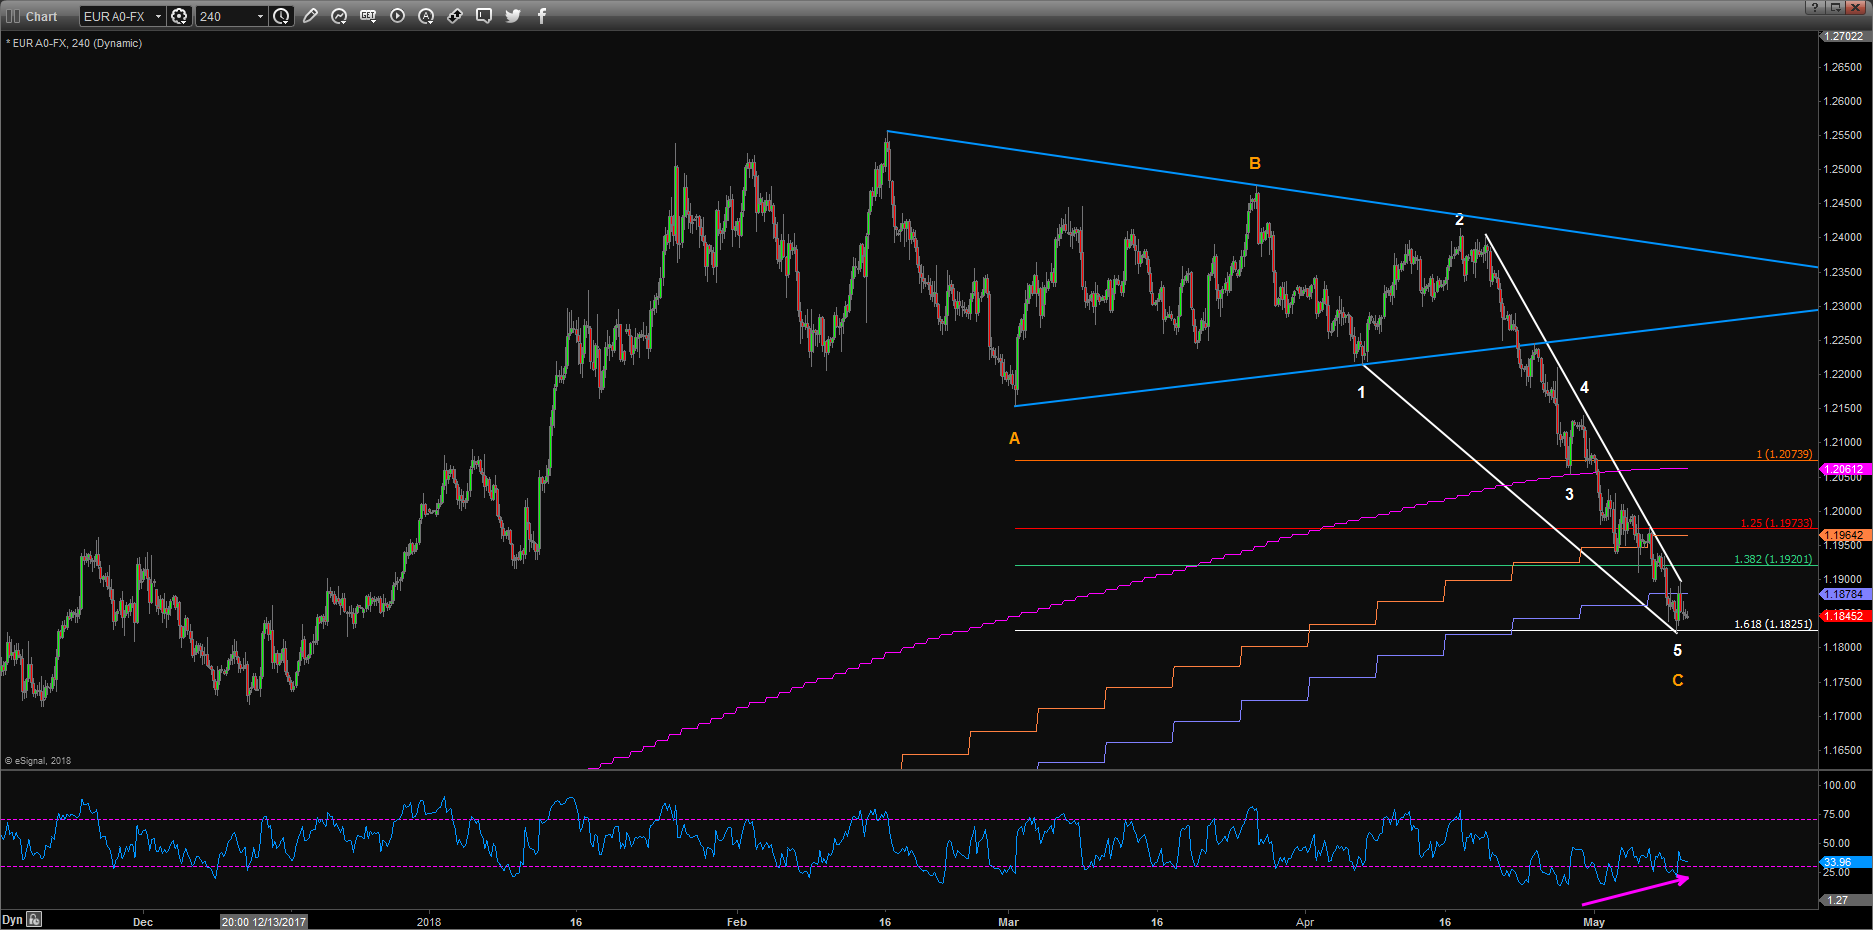
Elliott Wave Analysis: EURUSD,Sell at 1.2072
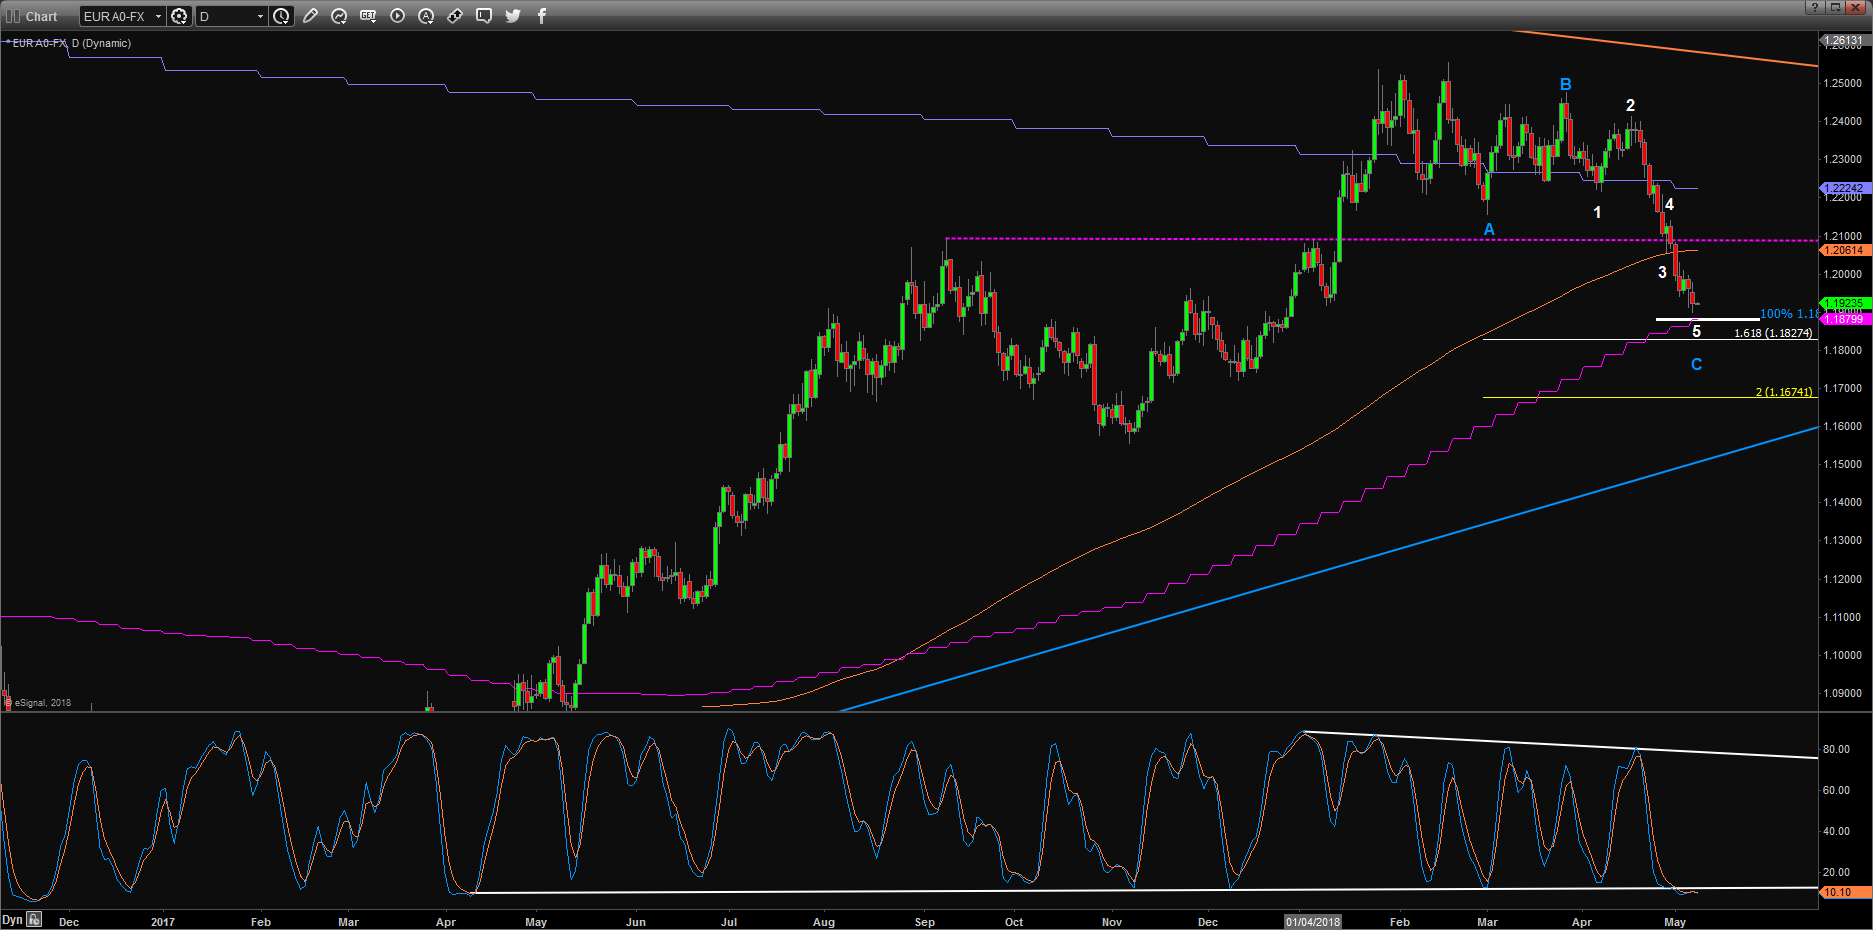
EURUSD traded below 200 day MA for the first time since May 2017.
The decline from 1.2476 is a 5 wave down pattern.
If 5=1, target should be 1.1879.
On intraday chart we see large divergence and a potential falling wedge formation.
Once upside resolved, price may consolidate for several days before next leg lower.
We'll try to re-build tactical short positions.
EURUSD Trade Idea:
Sell Limit @ 1.2072 SL @1.2169 Take Profit @ 1.1812
Załączniki:
http://forexsignal.love/aggressive-trend-scalper-ea/ 5 days' trial period is available. Welcome to backtesting!
Uczestnik z Apr 08, 2014
1140 postów
May 08, 2018 at 08:40
On yesterday session, the EURUSD tried to rise but quickly found enough selling pressure to turn south and closed near the low of the day, although managed to close within Friday’s range, which suggests being slightly on the bearish side of neutral.
The currency pair trading below the 10, the 50 and the 200-day moving averages that should provide dynamic resistance.
The key levels to watch: a key level at 1.2165 (resistance), the 200-day moving average at 1.2050 (resistance), a daily resistance at 1.2041, the 10-day moving average at 1.2000 (resistance), 2018 low at 1.1915 (support), a daily support at 1.1829.
"I trade to make money not to be right."
Uczestnik z Apr 08, 2014
1140 postów
May 09, 2018 at 08:35
On yesterday session, the EURUSD fell with a wide range and closed near the low of the day, in addition closed below Mondays’ low, which suggests a strong bearish momentum.
The currency pair trading below the 10, the 50 and the 200-day moving averages that should provide dynamic resistance.
The key levels to watch: a key level at 1.2165 (resistance), the 200-day moving average at 1.2049 (resistance), a daily resistance at 1.2041, the 10-day moving average at 1.1968 (resistance), 2018 low at 1.1915 (support), a daily support at 1.1829 and other daily support at 1.1753.
"I trade to make money not to be right."
Uczestnik z Dec 10, 2017
210 postów
May 09, 2018 at 18:38
The euro/dollar dropped to a new low for 2018 at 1.1837 yesterday. The price is under the support line of the downward channel, which implies a further drop down. Short-term expectations remain bearish to test support 1.1750 (weekly EMA 200). Resistance for the day is 1.1895. A clear break above this level could take the price to a neutral trading area with testing 1.1935/50, but I stay in bears' camp so far and any upward pressure should be considered a good opportunity for short positions.
Uczestnik z Apr 08, 2014
1140 postów
May 10, 2018 at 08:32
On yesterday session, the EURUSD went back and forward without any clear direction but closed in the red, in the middle of the daily range, in addition, managed to close within Tuesdays’ range, which suggests being clearly neutral, neither side is showing control.
The currency pair trading below the 10, the 50 and the 200-day moving averages that should provide dynamic resistance.
The key levels to watch: a key level at 1.2165 (resistance), the 200-day moving average at 1.2049 (resistance), a daily resistance at 1.2041, the 10-day moving average at 1.1942 (resistance), January low at 1.1915 (resistance), a daily support at 1.1829 and other daily support at 1.1753.
"I trade to make money not to be right."
May 10, 2018 at 11:59
Intraday Elliottwave Analysis: EURUSD, 1.1964 is key level to watch
EURUSD was just rejected by 161.8% extension from 1.2556.
Almost the same divergence and wedge like formation as DXY.
Close above 1.1964 will be the first recovery sign.
To the downside, I still expect 1.1790 could hold the price at least for the first time.
Support Levels: 1.1843 1.1836 1.1831 1.1824 1.1805 1.1795
Resistance Levels: 1.1868 1.1878 1.1885 1.1895 1.1898 1.1903
Intraday Trade Idea:
Sell Latentinterest Order: 1.1921
Buy Latentinterest Order: 1.1806
Załączniki:
http://forexsignal.love/aggressive-trend-scalper-ea/ 5 days' trial period is available. Welcome to backtesting!
Uczestnik z Nov 16, 2015
708 postów
May 10, 2018 at 12:42
The single currency continued to decline against the US dollar on Wednesday. The currency pair opened at 1.1864 and ended at 1.1850. The single currency in the early hours reached the support level at 1.1825, after which the price recovered positions and reached a peak of 1.1896. If the euro turns the resistance break at 1.1911, we can expect a 1.2055 test.
Uczestnik z Nov 16, 2015
708 postów
May 10, 2018 at 12:44
EUR/USD
Key levels to watch for:
Support: 1.1875; 1.1825;
Resistance: 1.1911; 1.2055;
Key levels to watch for:
Support: 1.1875; 1.1825;
Resistance: 1.1911; 1.2055;
Uczestnik z Dec 10, 2017
210 postów
May 10, 2018 at 14:05
The euro/dollar was indecisive yesterday. The signals are neutral for now. The price is in a range of 75 pips between 1.1895 and 1.820, suggesting a consolidation phase. A clear break above 1.1895 could lead to future test bulls testing at 1.1935/50, but I stay in the bear camp at this stage and any upward pressure should be seen as a good sales opportunity. On the downside, a clear break below 1.1820 will clear the way to 1.1750.
Uczestnik z Apr 08, 2014
1140 postów
May 11, 2018 at 08:06
On yesterday session, the EURUSD rallied with a wide range and closed near the high of the day, in addition, managed to close above Wednesday’s high, which suggests a strong bullish momentum.
The currency pair trading below the 10, the 50 and the 200-day moving averages that should provide dynamic resistance.
The key levels to watch: a key level at 1.2165 (resistance), the 200-day moving average at 1.2049 (resistance), a daily resistance at 1.2041, the 10-day moving average at 1.1931 (resistance), January low at 1.1915 (resistance), a daily support at 1.1829 and other daily support at 1.1753.
"I trade to make money not to be right."
May 11, 2018 at 08:58
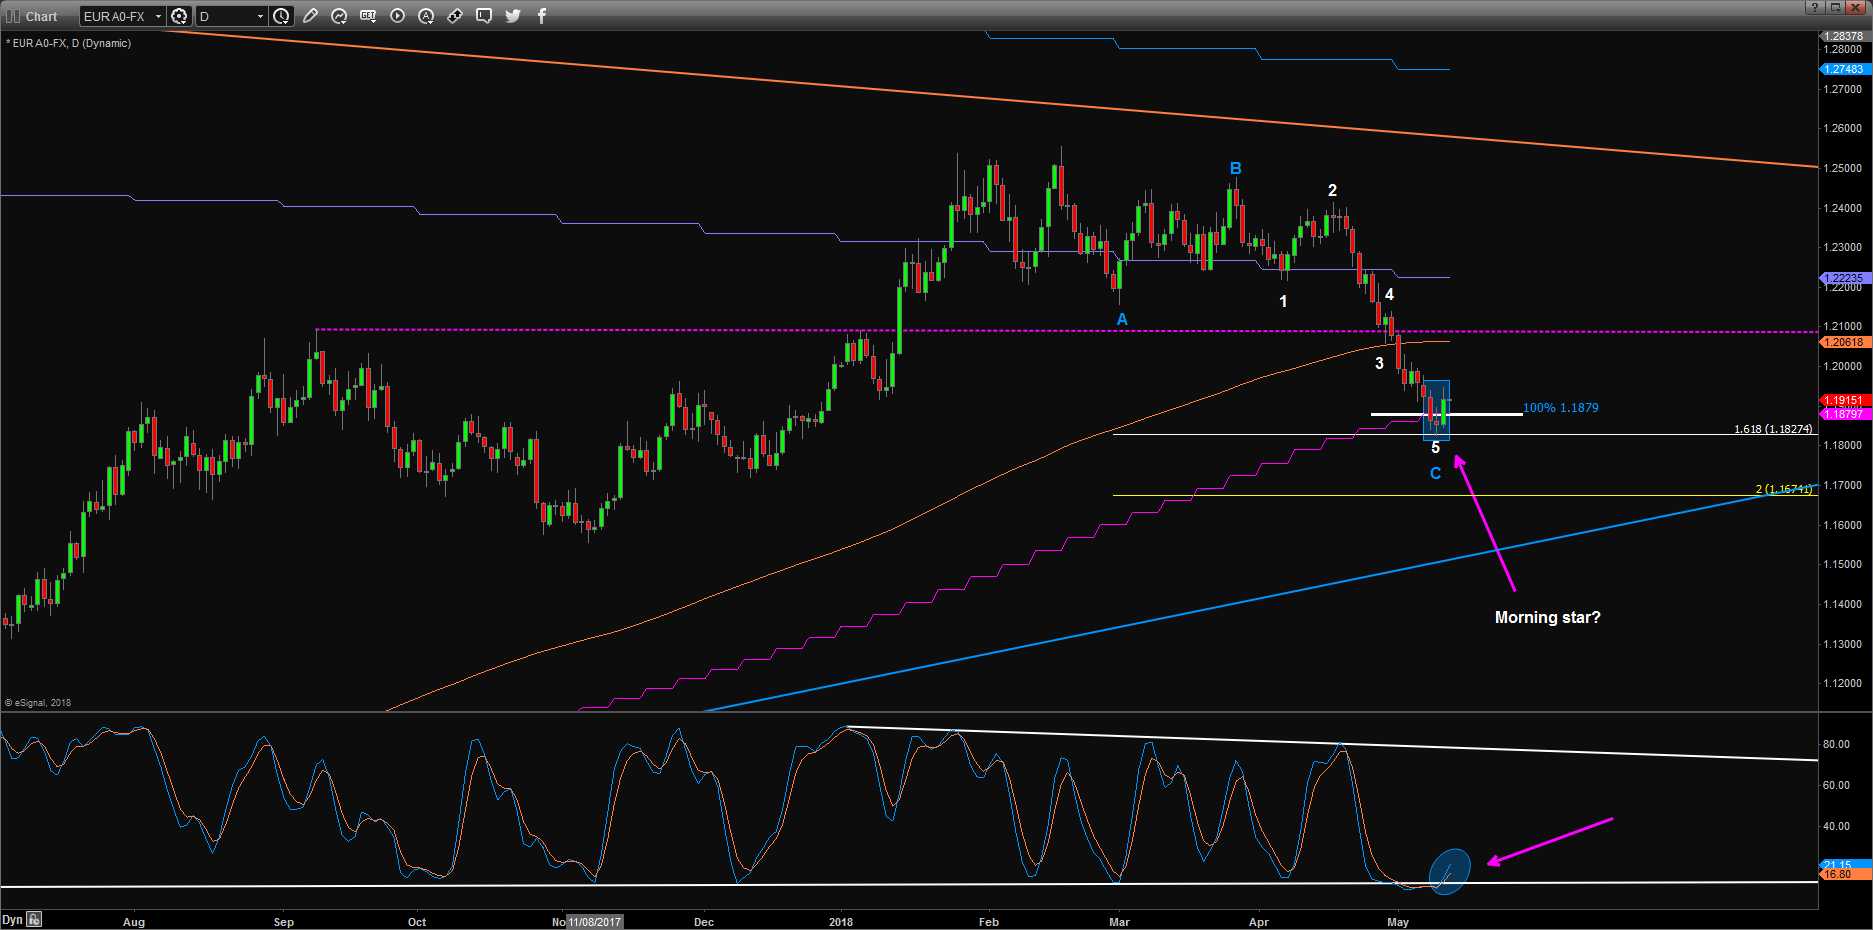
Elliott Wave Analysis: EURUSD, Long at spot
EURUSD finally break out from the falling wedge.
Daily osicillators are cross-over from their range low.
According to my system, we have a fresh daily buy signal, but still in weekly sell mode.
I suspect a near term low already in place.
Directly close below 1.1822 will negative this view.
EURUSD Trade Idea:
①Buy Limit @ 1.1897 SL @ 1.1820 Take Profit @ 1.1993/1.2072
②Buy Limit @ 1.1881 SL @ 1.1820 Take Profit @ 1.1993/1.2072
Załączniki:
http://forexsignal.love/aggressive-trend-scalper-ea/ 5 days' trial period is available. Welcome to backtesting!

Uczestnik z Oct 02, 2014
905 postów
May 11, 2018 at 17:46
Tough week for trading, it seems the euro is looking up now.
Positivity
Uczestnik z Dec 11, 2017
229 postów
May 14, 2018 at 06:42
The dollar is still under pressure, the pair is testing potential resistance at 1.20. It could be a short-term buying opportunity.
May 14, 2018 at 06:45
Intraday Elliottwave Analysis: EURUSD, expect 1.1863--1.2004 weekly range
EURUSD closed above the large falling wedge.
Price was just satisfied 161.8% extension from 1.2555.
Above 1.1827, Near term some consolidation is likely.
To the downside, 1.1790 is key level to watch.
I expect the price consolidate in 1.1863--1.2004 range this week.
Daily support Levels: 1.1928 1.1916 1.1896 1.1885 1.1872
Daily resistance Levels: 1.1965 1.1988 1.2010 1.2023
Intraday Trade Idea:
Sell Latentinterest Order: 1.1993
Buy Latentinterest Order: 1.1895
http://forexsignal.love/aggressive-trend-scalper-ea/ 5 days' trial period is available. Welcome to backtesting!
Uczestnik z Apr 08, 2014
1140 postów
May 14, 2018 at 07:35
On the last Friday’s session, the EURUSD went back and forward without any clear direction but and managed to close in the green, in the middle of the daily range, in addition, closed within Thursday’s range, which suggests being clearly neutral, neither side is showing control.
The currency pair managed to close above the 10-day moving average that should provide dynamic support, however, is still trading below the 50 and the 200-day moving averages that should provide dynamic resistance.
The key levels to watch: a key level at 1.2165 (resistance), the 200-day moving average at 1.2049 (resistance), a daily resistance at 1.2041, the 10-day moving average at 1.1931 (support), January low at 1.1915 (support), a daily support at 1.1829 and other daily support at 1.1753.
"I trade to make money not to be right."
May 15, 2018 at 06:41
Intraday Elliottwave Analysis: EURUSD, 1st target met
EURUSD reached profit target of 1.1993 yesterday.
There's various possible wave count results from here.
Enough patience is needed for now.
Daily support Levels: 1.1917 1.1910 1.1904 1.1897 1.1875 1.1869
Daily resistance Levels: 1.1948 1.1957 1.1970 1.1981 1.1993 1.2023
Intraday Trade Idea:
Sell Latentinterest Order: 1.1981
Buy Latentinterest Order: 1.1877
http://forexsignal.love/aggressive-trend-scalper-ea/ 5 days' trial period is available. Welcome to backtesting!


