


EUR/USD

เป็นสมาชิกตั้งแต่ Jul 10, 2014
1117 โพสต์
Jun 05, 2015 at 19:39
The news from Greece and the US Non-farm Payrolls had a considerable effect on EUR/USD today. The question is whether the pair will continue climbing next week or is this a turning point.

เป็นสมาชิกตั้งแต่ Oct 27, 2014
53 โพสต์
Jun 05, 2015 at 19:43
Why should eur usd raise ?
forex_trader_252532
เป็นสมาชิกตั้งแต่ May 27, 2015
10 โพสต์
Jun 06, 2015 at 08:16
jackassfx posted:
no.. eurousd left falling pattern at 1.1186 and that it kissed... so key area to watch as per pattern is 1.1135... if that gone that euro towards 1.0993...
Euro also left falling pattern at 1.0993... so now euro completed 1.1186 pattern by kissing.. and it will consolidate... only break of 1.128 an 1.132 will drive euro up... otherwise i see euro bam down to 1.0993.. and towards 1.08... lets see what brings nfp..
As i said yesterday.. euro left falling patterns.. and it will go for it to complete.. so fall below 1.11 is confirming that eu will go for 1.0993... and any clear break of it with fall below 1.0995 will lead to 1.08.. all in all i see euro downwards towards 1.0..
usdchf again spiked from 0.9357 neckline support of double bottom and any break of 0.95 and 0.955 will lead towards 0.98..
เป็นสมาชิกตั้งแต่ Jun 08, 2014
454 โพสต์
Jun 06, 2015 at 19:41
victoriajensen posted:
The news from Greece and the US Non-farm Payrolls had a considerable effect on EUR/USD today. The question is whether the pair will continue climbing next week or is this a turning point.
I think we will see a further drop on the pair on Monday.

Jun 07, 2015 at 15:59
Hey everyone!
I would like to share with you an interesting way to interpret a price movement. So if you are tired of using some questionable support and resistance lines, moving averages, etc. - this method will be right for you, because it shows you the anatomy of a market.
As you may know the market makers are using various derivatives to hedge their positions. Like currency futures or options, swaps, forwards. Guess what! We can use that!
So here I will show you how I use information about FX Options to trade spot.
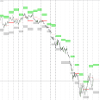
On the daily chart you can see EUR/USD. The green zones are representing a potential resistant and the gray ones a potential support. In between there is a balance line, which is just arithmetical average. I draw those zones once a month and they stay for entire month unchanged. The data for them is results of options trading, which everyone can download from Chicago Exchange website.
So I go to Chicago Exchange website, download some data and draw it on the chart! And here we have a price corridor.
The reason why the price shouldn’t go above or below those zones is that in this case the market makers will start losing big money and they definitely don’t like that. However sometimes it happens, so there are some tricks I use to predict that.
This method of market interpretation is based on facts, on real data, on reals results and not on some mysterious historical or hypothetical performance. I think, its way better than some moving averages.
However this method cannot be used alone but you can easy implement it to any strategy you want. It is perfect for swing trading on daily or H4 chart. Having those zones on a chart make you see a skeleton of the price.
I made a separate topic about this method:
https://www.myfxbook.com/community/experienced-traders/fx-derivatives-for-spot-analysis/973437,1
Subscribe to it, if you are interested to learn more
I would like to share with you an interesting way to interpret a price movement. So if you are tired of using some questionable support and resistance lines, moving averages, etc. - this method will be right for you, because it shows you the anatomy of a market.
As you may know the market makers are using various derivatives to hedge their positions. Like currency futures or options, swaps, forwards. Guess what! We can use that!
So here I will show you how I use information about FX Options to trade spot.
On the daily chart you can see EUR/USD. The green zones are representing a potential resistant and the gray ones a potential support. In between there is a balance line, which is just arithmetical average. I draw those zones once a month and they stay for entire month unchanged. The data for them is results of options trading, which everyone can download from Chicago Exchange website.
So I go to Chicago Exchange website, download some data and draw it on the chart! And here we have a price corridor.
The reason why the price shouldn’t go above or below those zones is that in this case the market makers will start losing big money and they definitely don’t like that. However sometimes it happens, so there are some tricks I use to predict that.
This method of market interpretation is based on facts, on real data, on reals results and not on some mysterious historical or hypothetical performance. I think, its way better than some moving averages.
However this method cannot be used alone but you can easy implement it to any strategy you want. It is perfect for swing trading on daily or H4 chart. Having those zones on a chart make you see a skeleton of the price.
I made a separate topic about this method:
https://www.myfxbook.com/community/experienced-traders/fx-derivatives-for-spot-analysis/973437,1
Subscribe to it, if you are interested to learn more
ไฟล์แนบ :
avoblikov@
Jun 07, 2015 at 21:46
sherifFares posted:victoriajensen posted:
The news from Greece and the US Non-farm Payrolls had a considerable effect on EUR/USD today. The question is whether the pair will continue climbing next week or is this a turning point.
I think we will see a further drop on the pair on Monday.
I agree, we have a small gap.


เป็นสมาชิกตั้งแต่ Nov 11, 2012
271 โพสต์
Jun 08, 2015 at 07:19
prachait posted:
Anyone have a review on movement of pair
EURUSD affecting NZDUSD and AUDNZD Pairs in coming week from Jun 7 - Jun 12 2015 ??
Thanks, Prachait
EUR/USD is moving in tandem with AUD/NZD with 77% positive correlation and no clear correlation with NZD/USD (only -30%) is visible.
antariks1@

Jun 08, 2015 at 12:28
EUR recorded a second consequential reduction against the dollar on Friday. The session started at a price of 1.1237 and in the hours around noon it reached the highest level for the day at 1.1279. Later the price went down sharply, reaching levels around 1.1051. At the end of the day the euro finished at 1.1110 and if the downward trend continues, we can expect the first test of support at 1.0815.
เป็นสมาชิกตั้งแต่ Oct 08, 2011
137 โพสต์
Jun 08, 2015 at 18:01
EUR/USD - daily chart
after a major entry formation, the pair is currently on the 1st hook.
Entries are as follows:
use the high from Friday (ask price +1 pip) for a buy-stop entry
or
use the hook price, which is the high from last Thursday
add 1 pip to the high (ask price)
trade to above the last full correction of the weekly chart
which is 1.1533 on our charts
"a little bit of knowledge is a dangerous thing"
เป็นสมาชิกตั้งแต่ Oct 08, 2011
137 โพสต์
Jun 08, 2015 at 18:12
EUR/USD - daily chart
place your SL 5 pips below the low from Friday.
measure the distance from SL to entry price and calculate your lot size.
How to properly calculate the lot size I have described in an earlier posting.
If you do it this way, it will be a trade just like any other trade.
Never trade without a SL, always calculate your risk, and you will never regret a trade.
The high from Friday is the 'early' hook entry.
The way we do it is - we let prices go through it once, and take the trade on the second time around. (by watching the 1 hr chart)
If prices continue to rise and we miss the trade, we trade it on the hook itself (Thursday high)
"a little bit of knowledge is a dangerous thing"
เป็นสมาชิกตั้งแต่ Jul 10, 2014
1117 โพสต์
Jun 08, 2015 at 18:29
The US Non-Farm Payrolls had a considerable effect on EUR/USD on Friday, causing the pair to drop over 150 pips, but today it began climbing again. The pair will likely test the resistance at 1.1440 and should it manage to break above that level it will probably head for target 1.1550 - 1560.
เป็นสมาชิกตั้งแต่ Jun 08, 2014
454 โพสต์
Jun 08, 2015 at 19:06
EUR/USD gained all the losses of thursday and friday and now price again is testing 1.1300


เป็นสมาชิกตั้งแต่ Nov 11, 2012
271 โพสต์
Jun 09, 2015 at 07:44
This is Tuesday now man.....LOL
antariks1@
เป็นสมาชิกตั้งแต่ Jul 10, 2014
1117 โพสต์
Jun 09, 2015 at 13:33
EUR/USD broke above 1.1300 but bounced off the resistance at 1.1340. It looks like a sideways channel is about to form on the four hour filter chart so I expect a move to the downside again until the pair reachest the support at 1.1090.
Jun 09, 2015 at 18:51
The euro registered a sharp rise in the first day of the new week after upward trend throughout the day. The session launched at a price of 1.1096, then the direction went down slightly, but in the afternoon the couple started upward move and at the end of the day finished at the price of 1.1302. In case continuing in upward direction, we can expect a test of resistance at 1.1467.


