


Advertisement
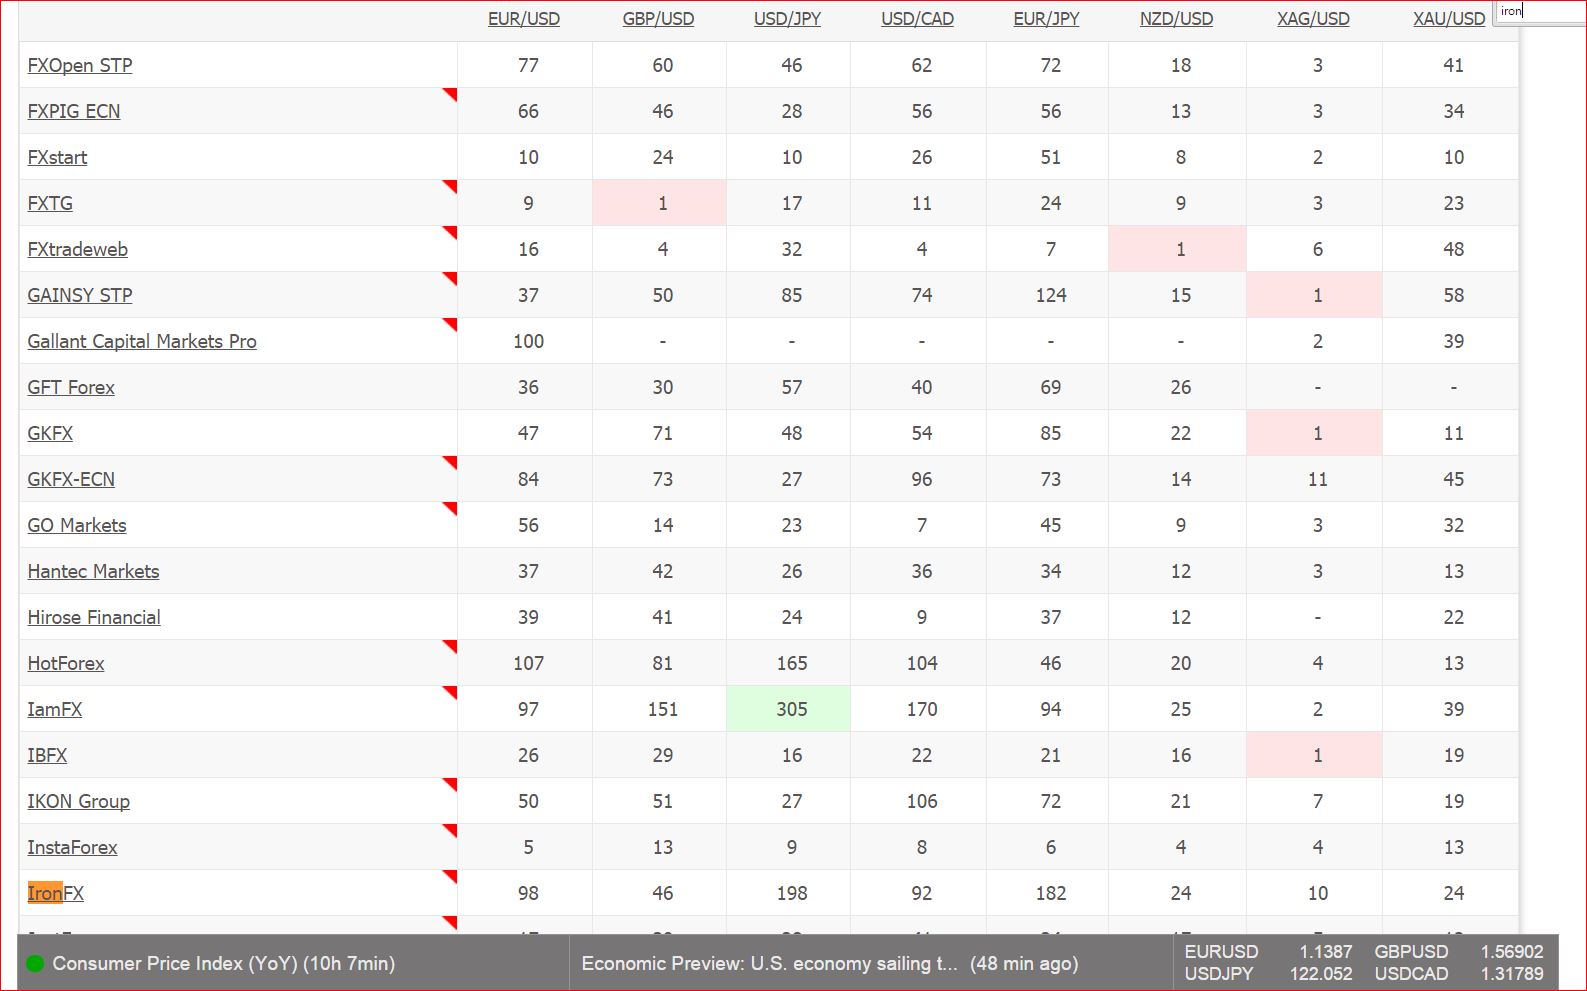
Are these numbers on Myxfbook real?
Aug 24, 2015 at 17:02
1,262 การดู
5 Replies

Aug 24, 2015 at 18:34
(แก้ไขแล้ว Aug 24, 2015 at 18:41)
Nope this chart from myfxbook is very misleading. These charts are just from the ticks recorded of a broker's price feed.You can hook mt4 with a price feed that changes many times over and get a higher 'volume' in this myfxbook volume recorder . In short, those are not real volumes you are looking at. This is more like the mt4 kind of volumes.
Volume of a tick differs from another tick. To understand maybe you could look at depth of market. You can have a look at ctrader DoM.
Volume of a tick differs from another tick. To understand maybe you could look at depth of market. You can have a look at ctrader DoM.
Never Give Up!

forex_trader_29148
เป็นสมาชิกตั้งแต่ Feb 11, 2011
1768 โพสต์
Aug 24, 2015 at 20:53
(แก้ไขแล้ว Aug 24, 2015 at 20:56)
savantfx posted:
Nope this chart from myfxbook is very misleading. These charts are just from the ticks recorded of a broker's price feed.You can hook mt4 with a price feed that changes many times over and get a higher 'volume' in this myfxbook volume recorder . In short, those are not real volumes you are looking at. This is more like the mt4 kind of volumes.
Volume of a tick differs from another tick. To understand maybe you could look at depth of market. You can have a look at ctrader DoM.
thanks for your great expertise
Aug 26, 2015 at 09:18
rob559 posted:savantfx posted:
Nope this chart from myfxbook is very misleading. These charts are just from the ticks recorded of a broker's price feed.You can hook mt4 with a price feed that changes many times over and get a higher 'volume' in this myfxbook volume recorder . In short, those are not real volumes you are looking at. This is more like the mt4 kind of volumes.
Volume of a tick differs from another tick. To understand maybe you could look at depth of market. You can have a look at ctrader DoM.
thanks for your great expertise
Glad to help my friend :)
Never Give Up!


*การใช้งานเชิงพาณิชย์และสแปมจะไม่ได้รับการยอมรับ และอาจส่งผลให้บัญชีถูกยกเลิก
เคล็ดลับ: การโพสต์รูปภาพ/youtube url จะฝังลงในโพสต์ของคุณโดยอัตโนมัติ!
เคล็ดลับ: พิมพ์เครื่องหมาย @ เพื่อป้อนชื่อผู้ใช้ที่เข้าร่วมการสนทนานี้โดยอัตโนมัติ


